Builder Dashboard
UX/UI + Research
Builder Dashboard is a reporting dashboard for homebuilders and internal account managers to view and download data.
Project Type
Reporting Dashboard
Goals
We want to provide a self-serving dashboard for homebuilders and Zillow's account managers to view, configure and download data the way they want it.
Research
We talked to account managers the sales analytics team to learn what reports they usually send to clients and what metrics builders are particularly interested in. We learned they were receiving excel sheets manually from the support team and customized it for communications with builders.
At Zillow, we already have a persona for homebuilders. But we want to learn more about user needs and expectations for this project. From the research, we learned:
Empathize & Define
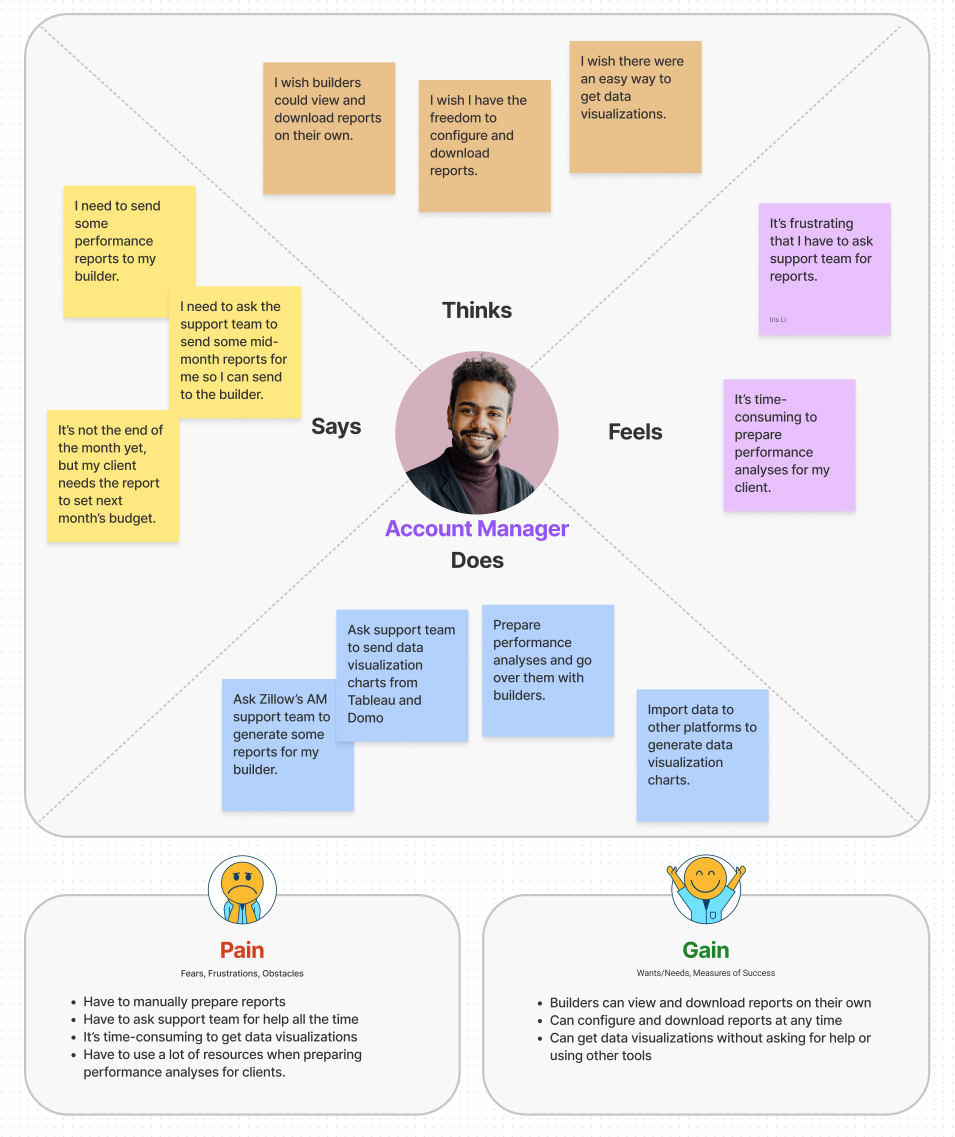
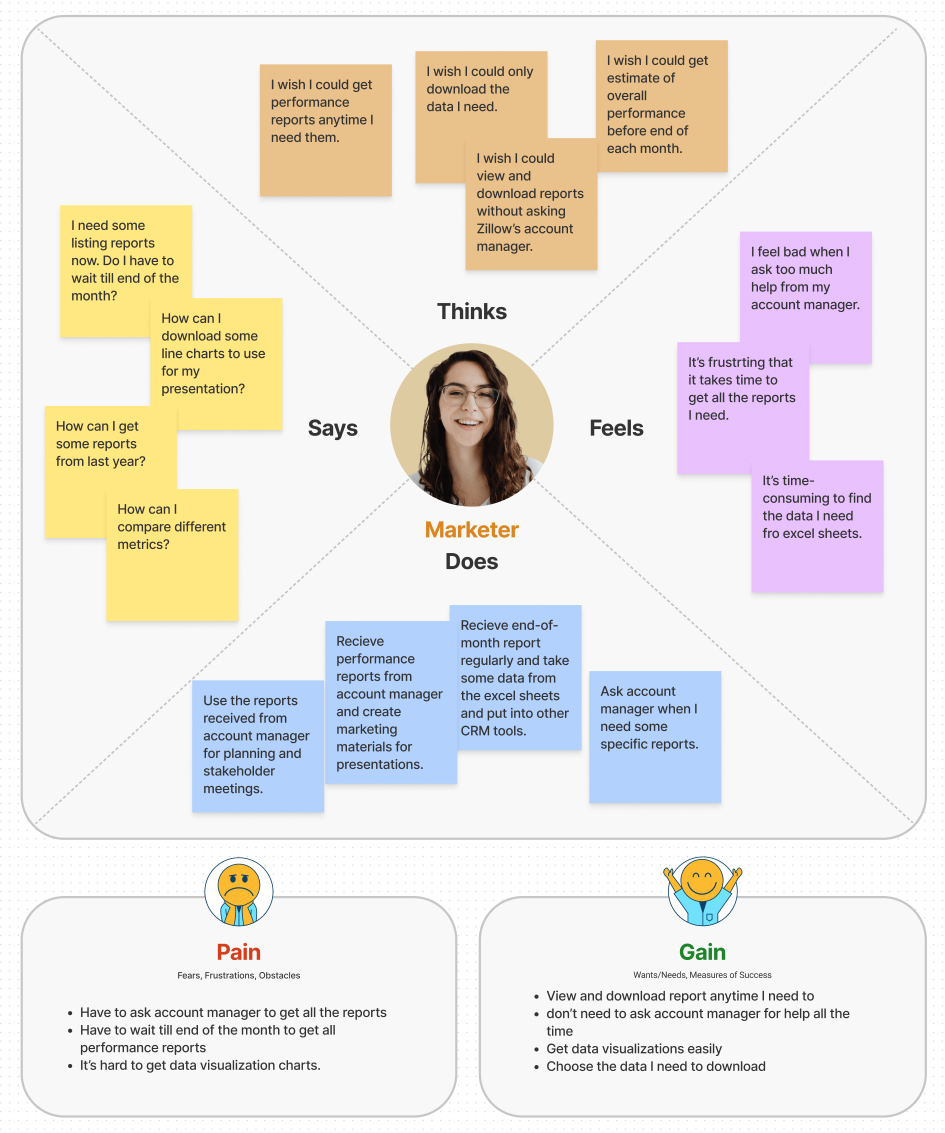
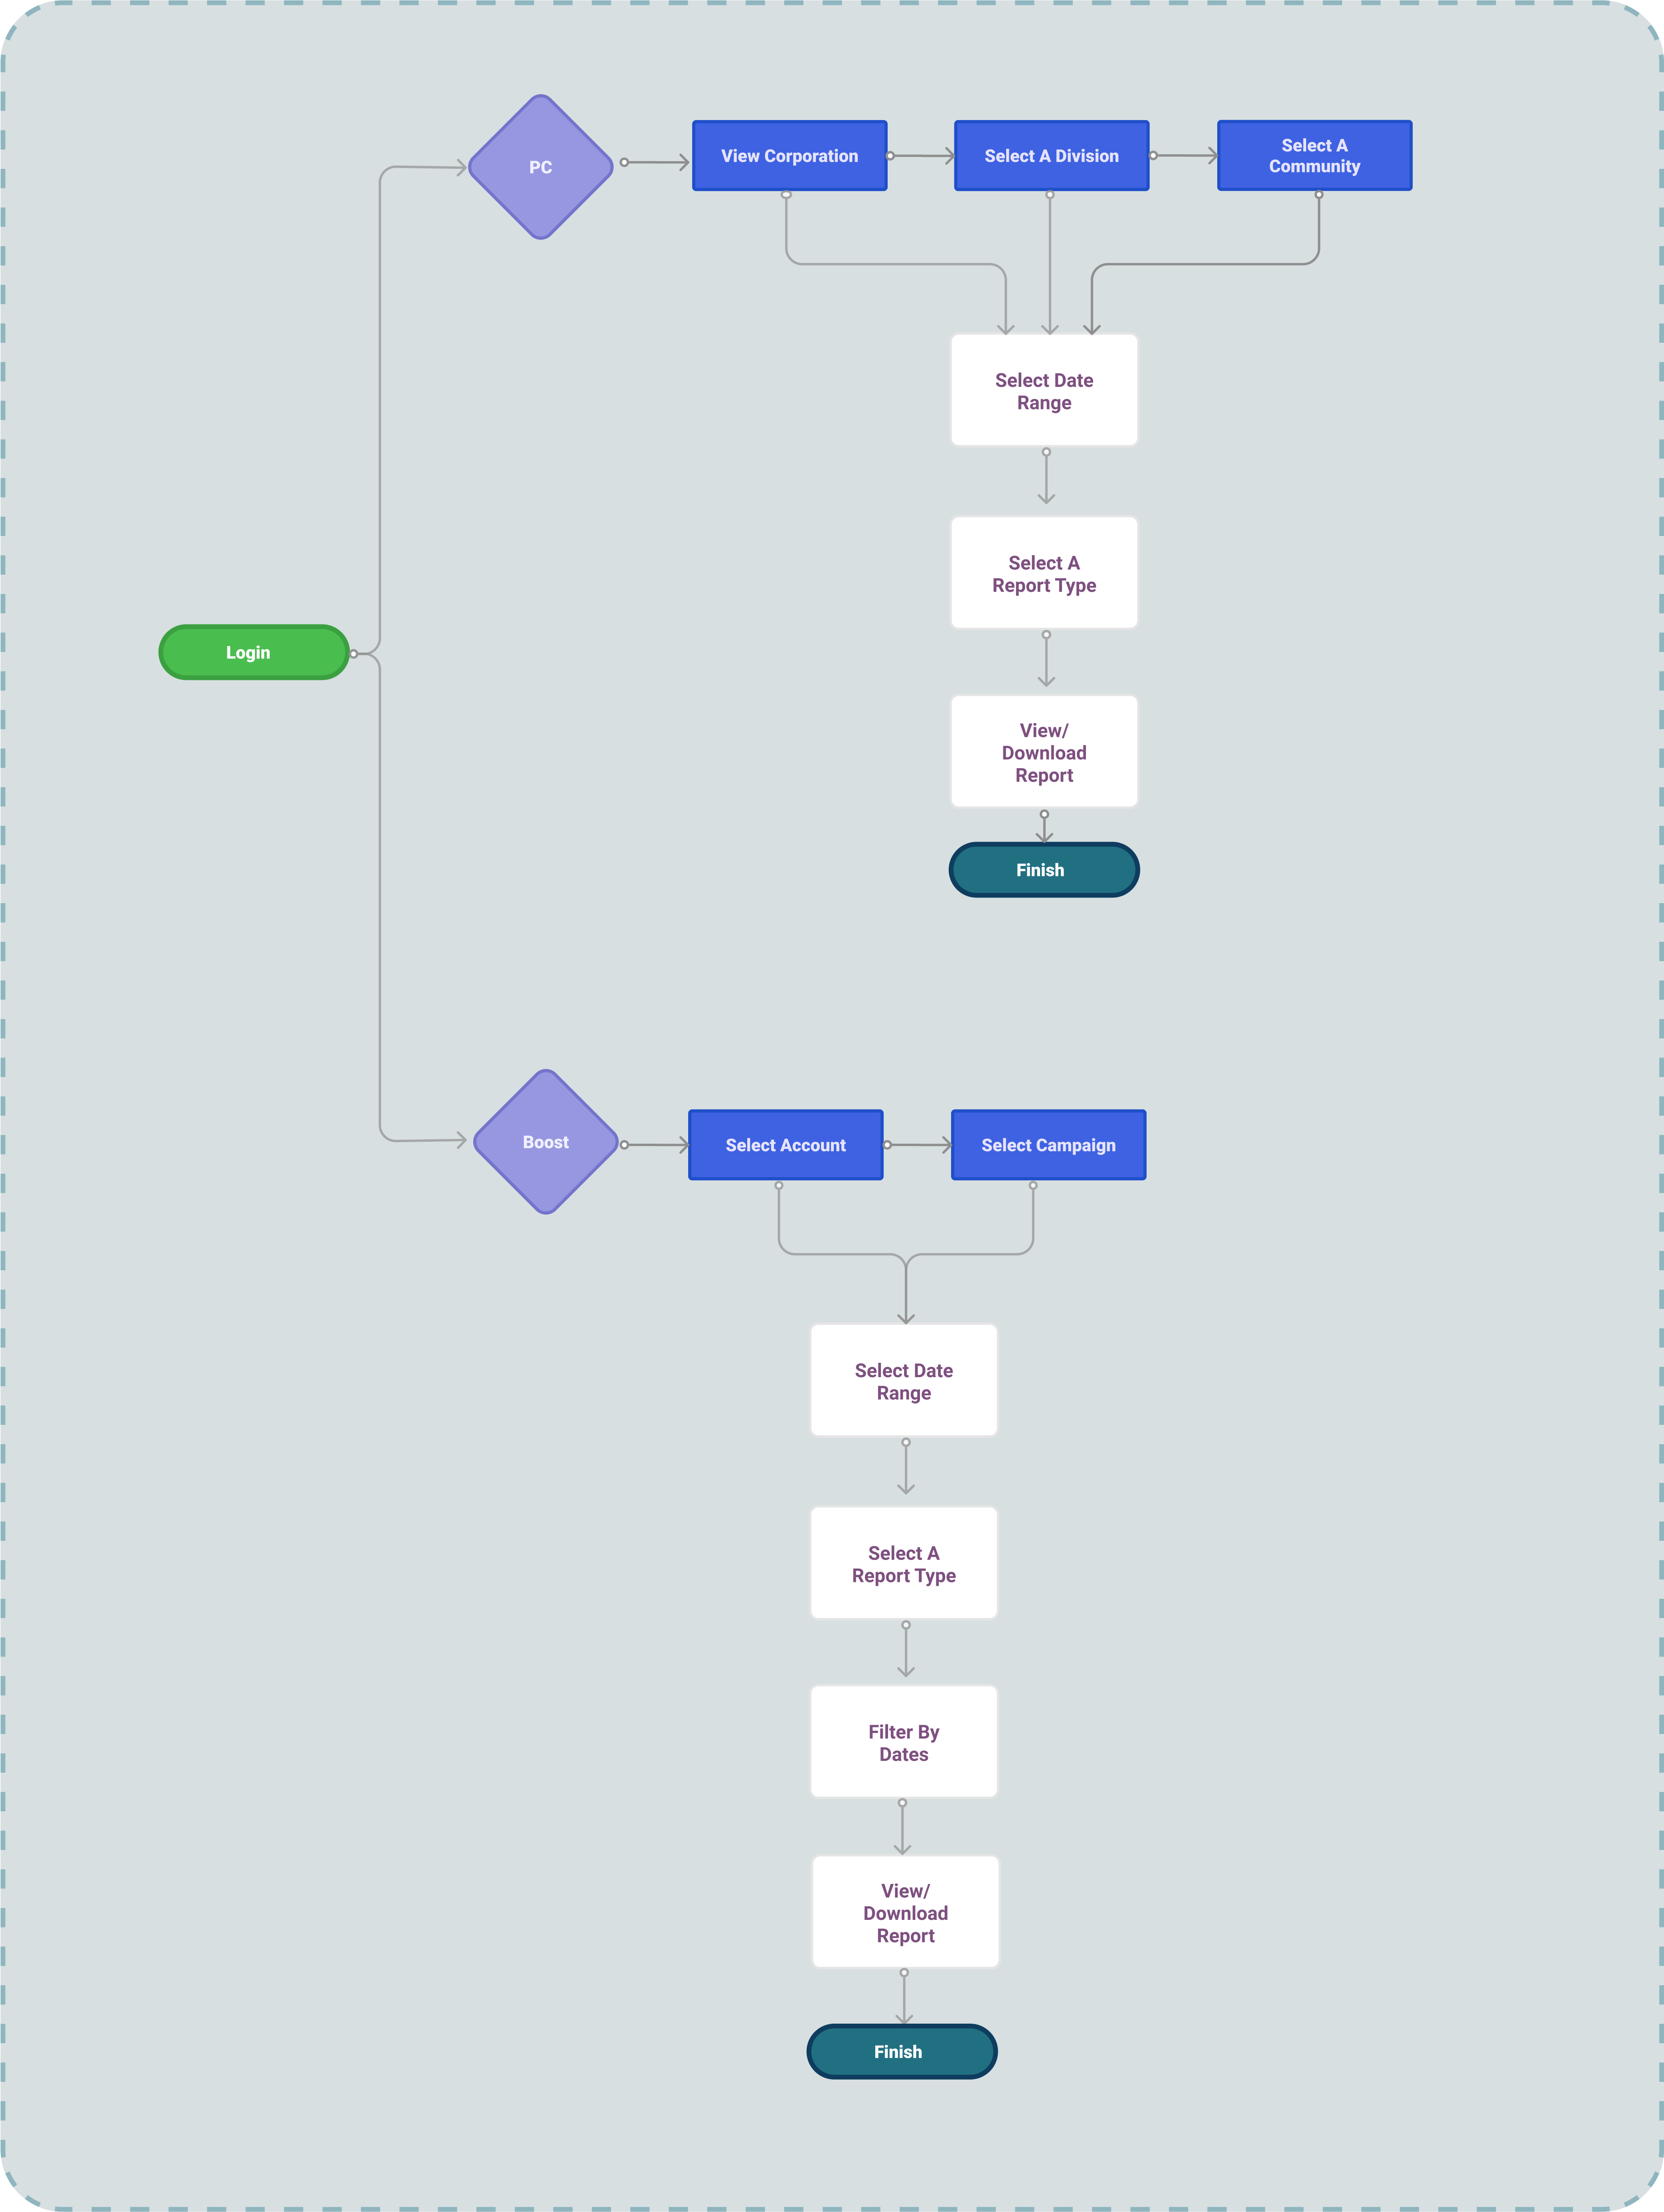
We created empathy maps for the 2 user types: account manager and marketer for builders, and also defined the two user types share the same task flow. The only difference is the permission level.
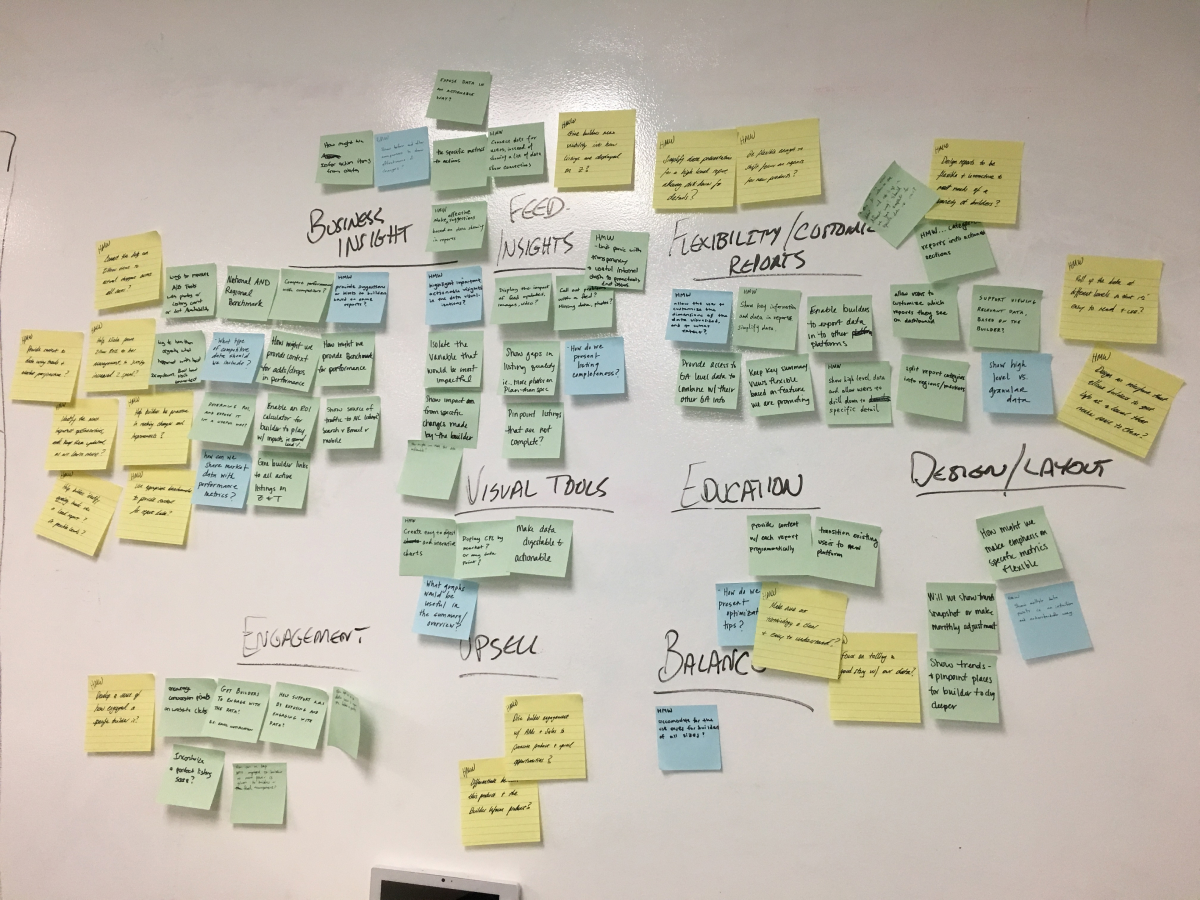
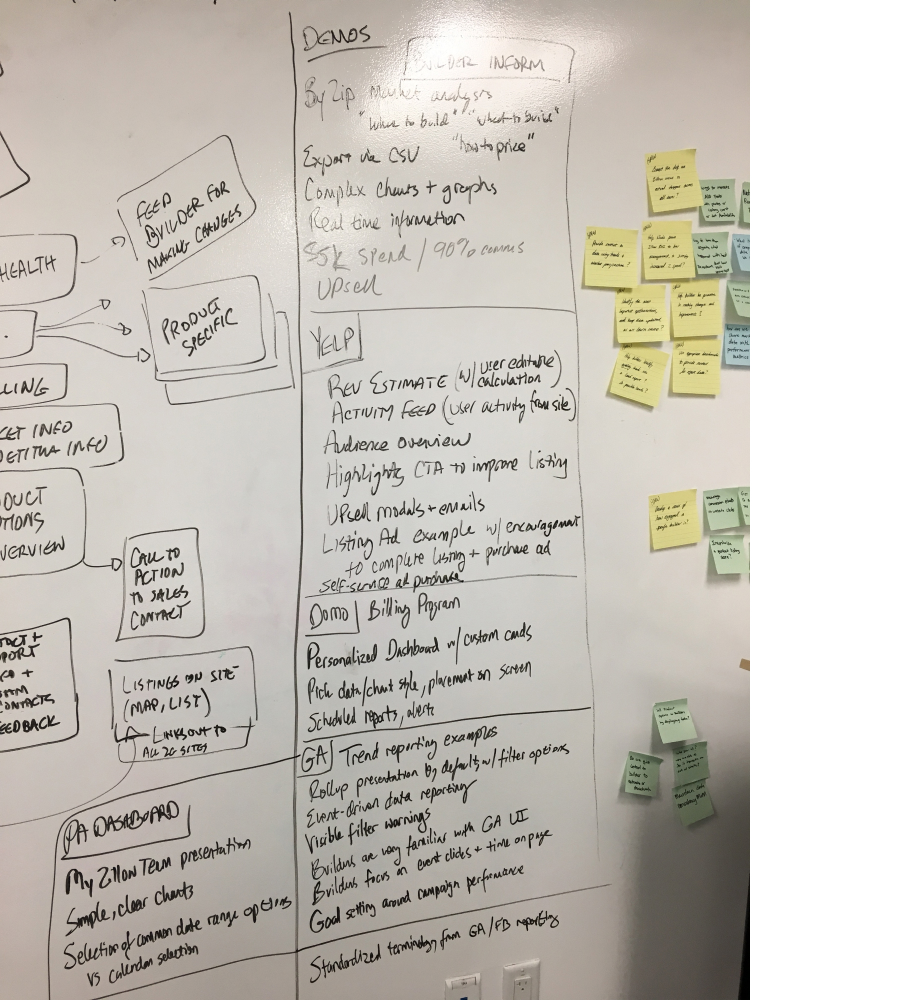
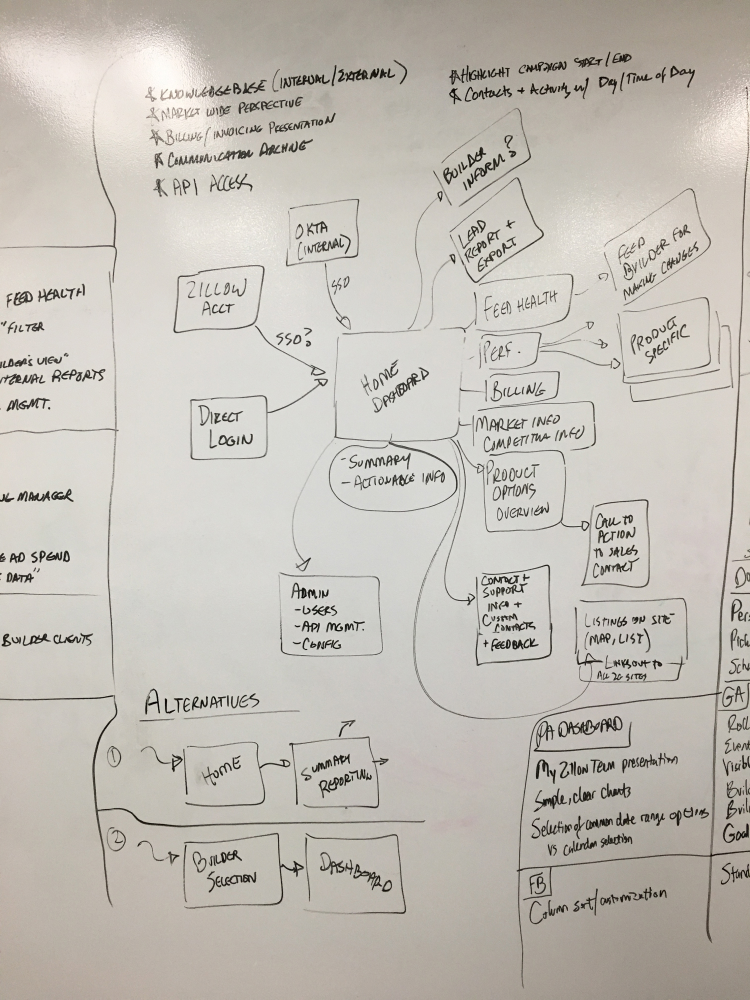
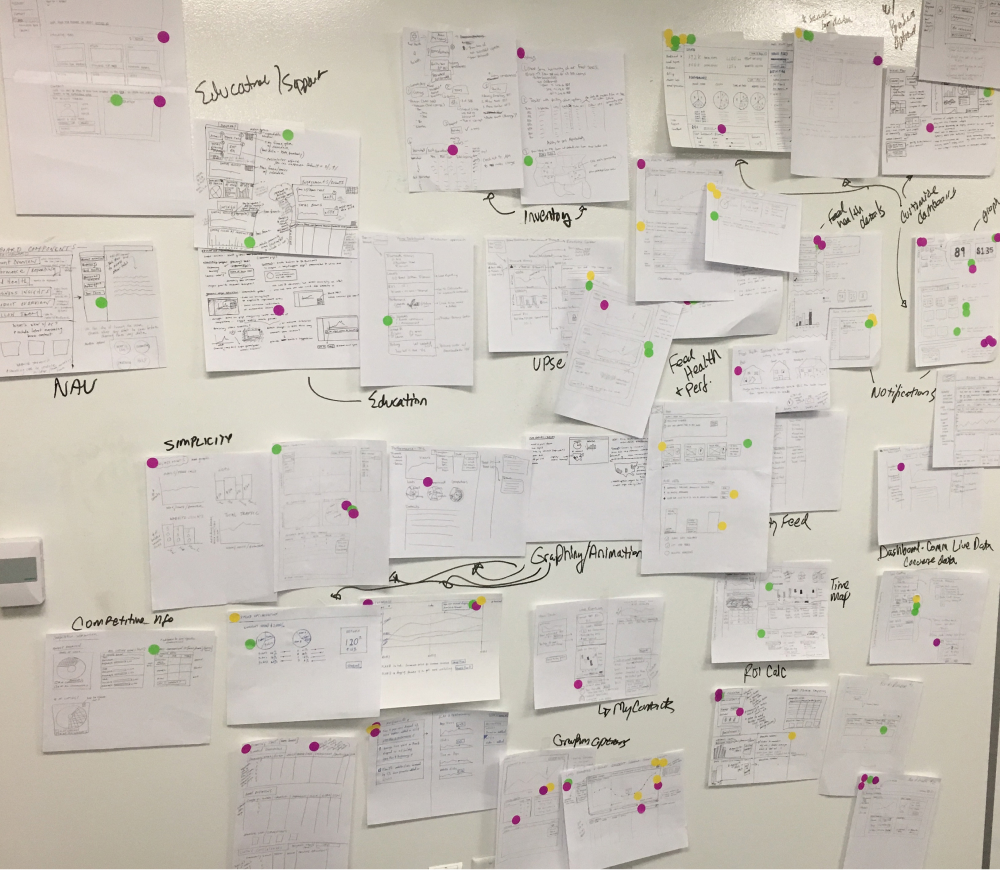
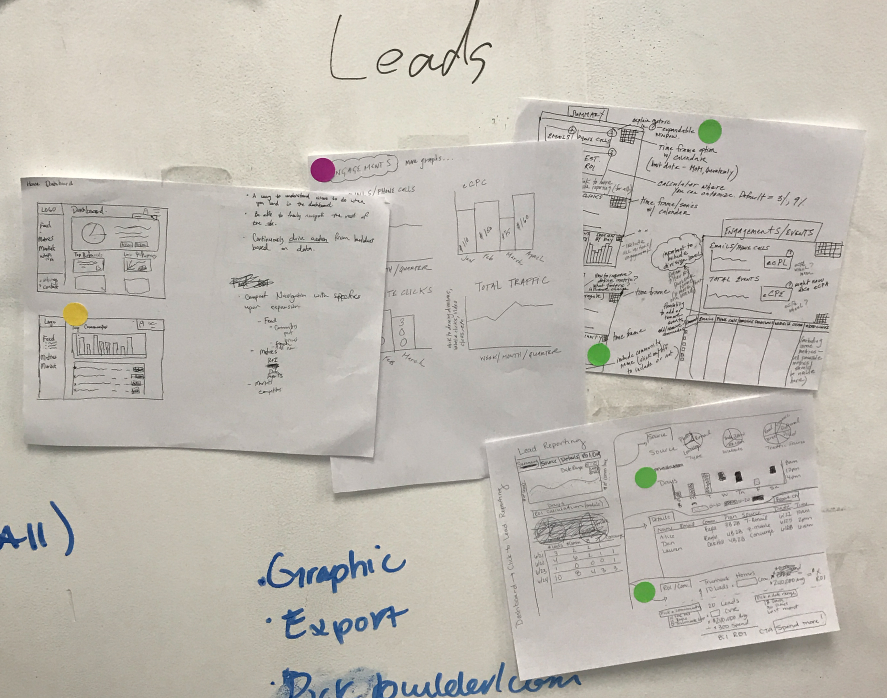
Ideation
The team got together, brainstorming possible solutions. We voted on the ones we liked. The core working group (PM, dev manager, and design) evaluated the selected ideas and boiled them down to possible solutions.
Challenges & Solutions
There are a massive amount of data users want to view, configure and download. The main challengers are:
We focused on these solutions:
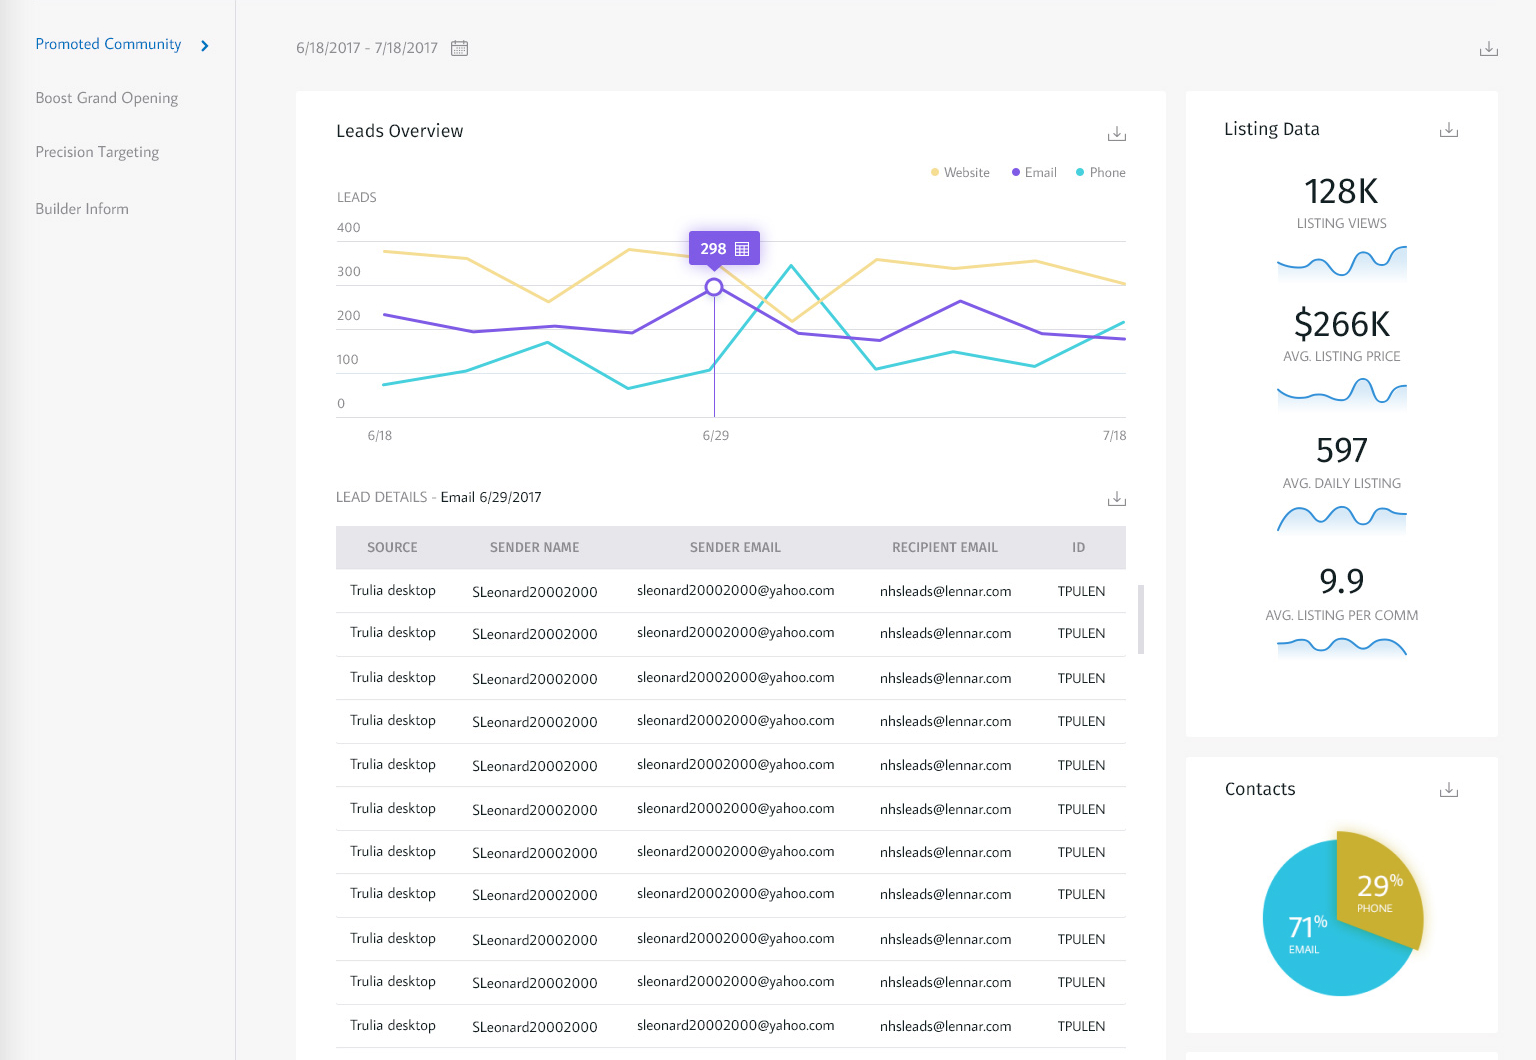
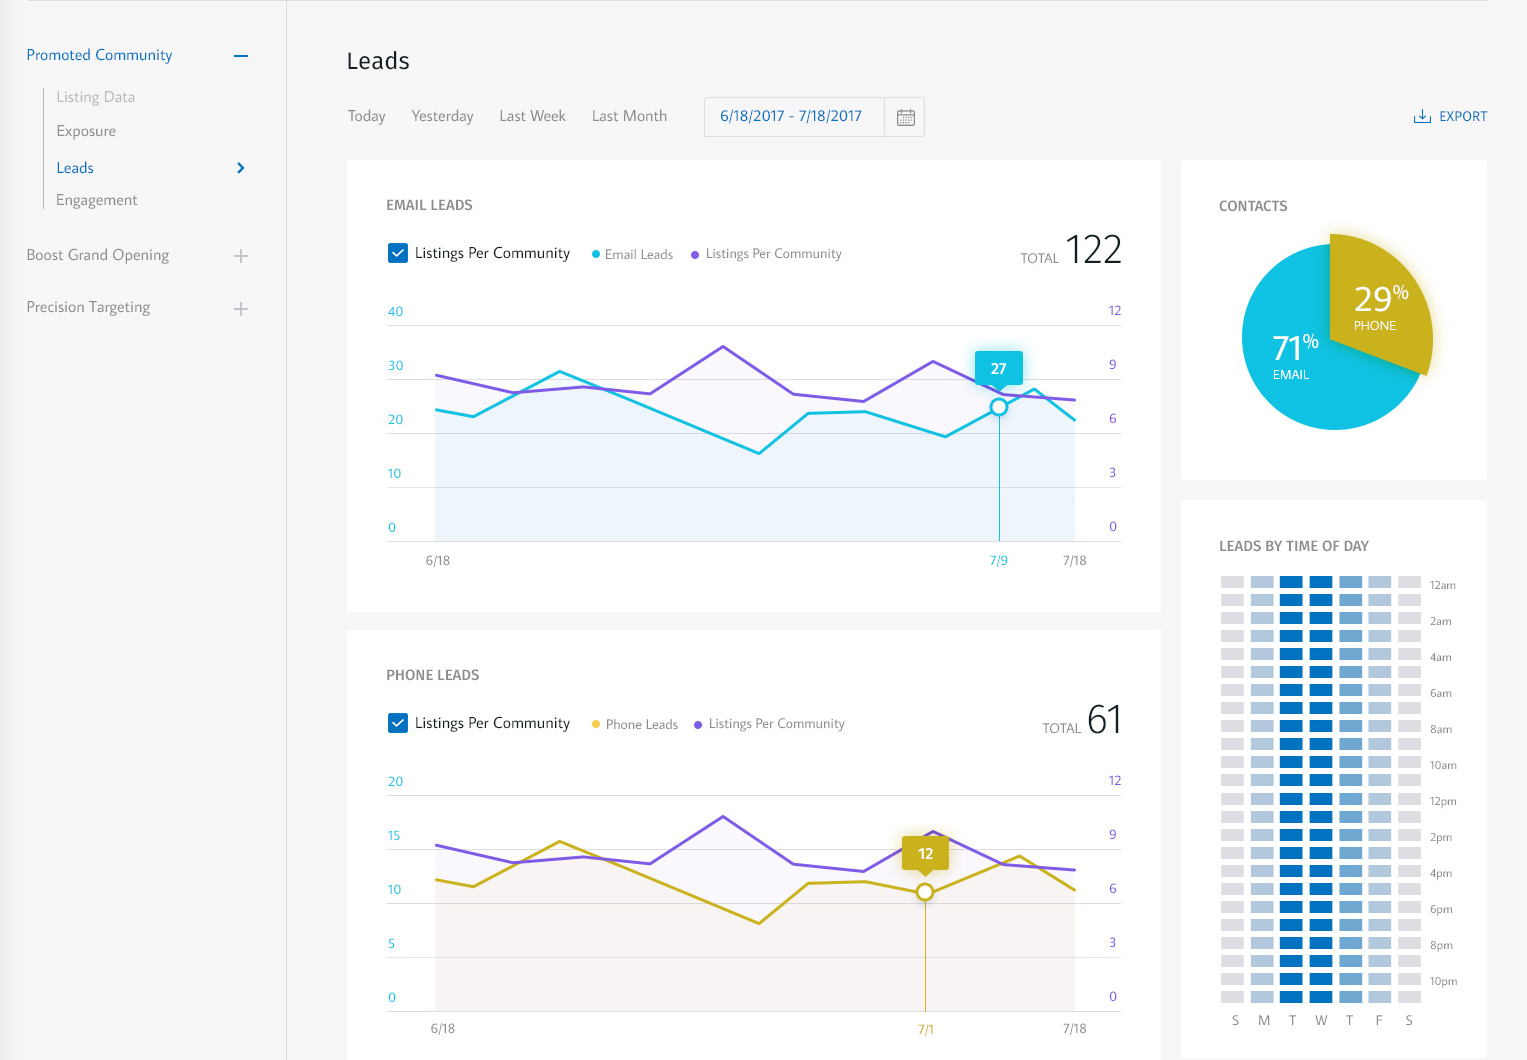
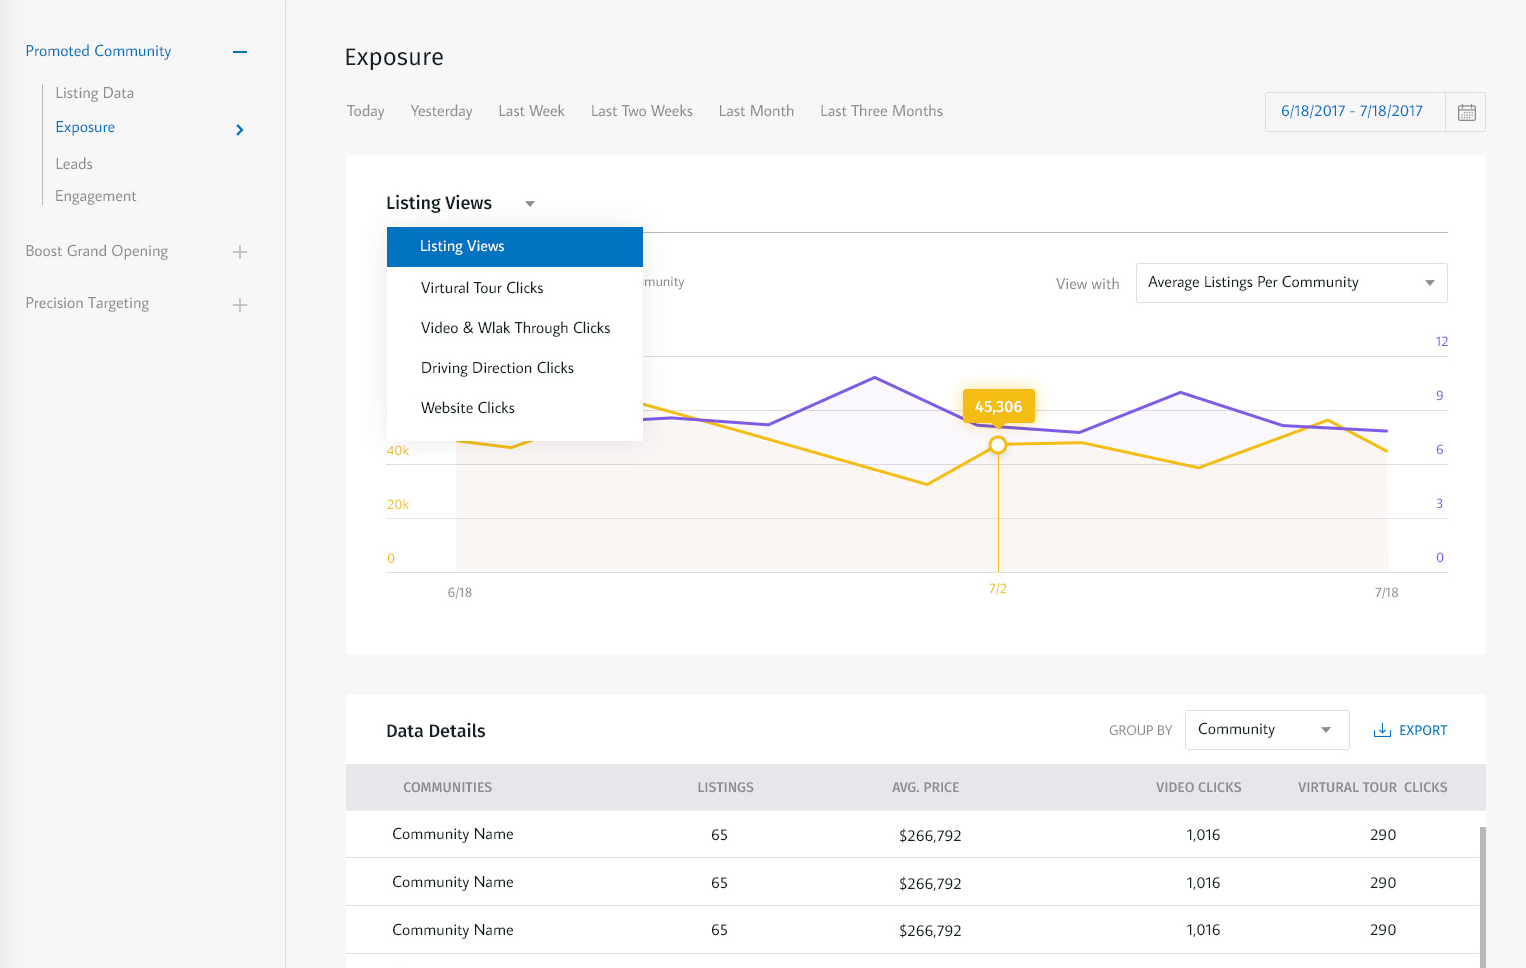
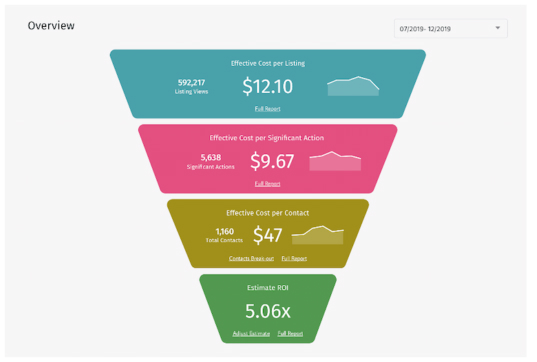
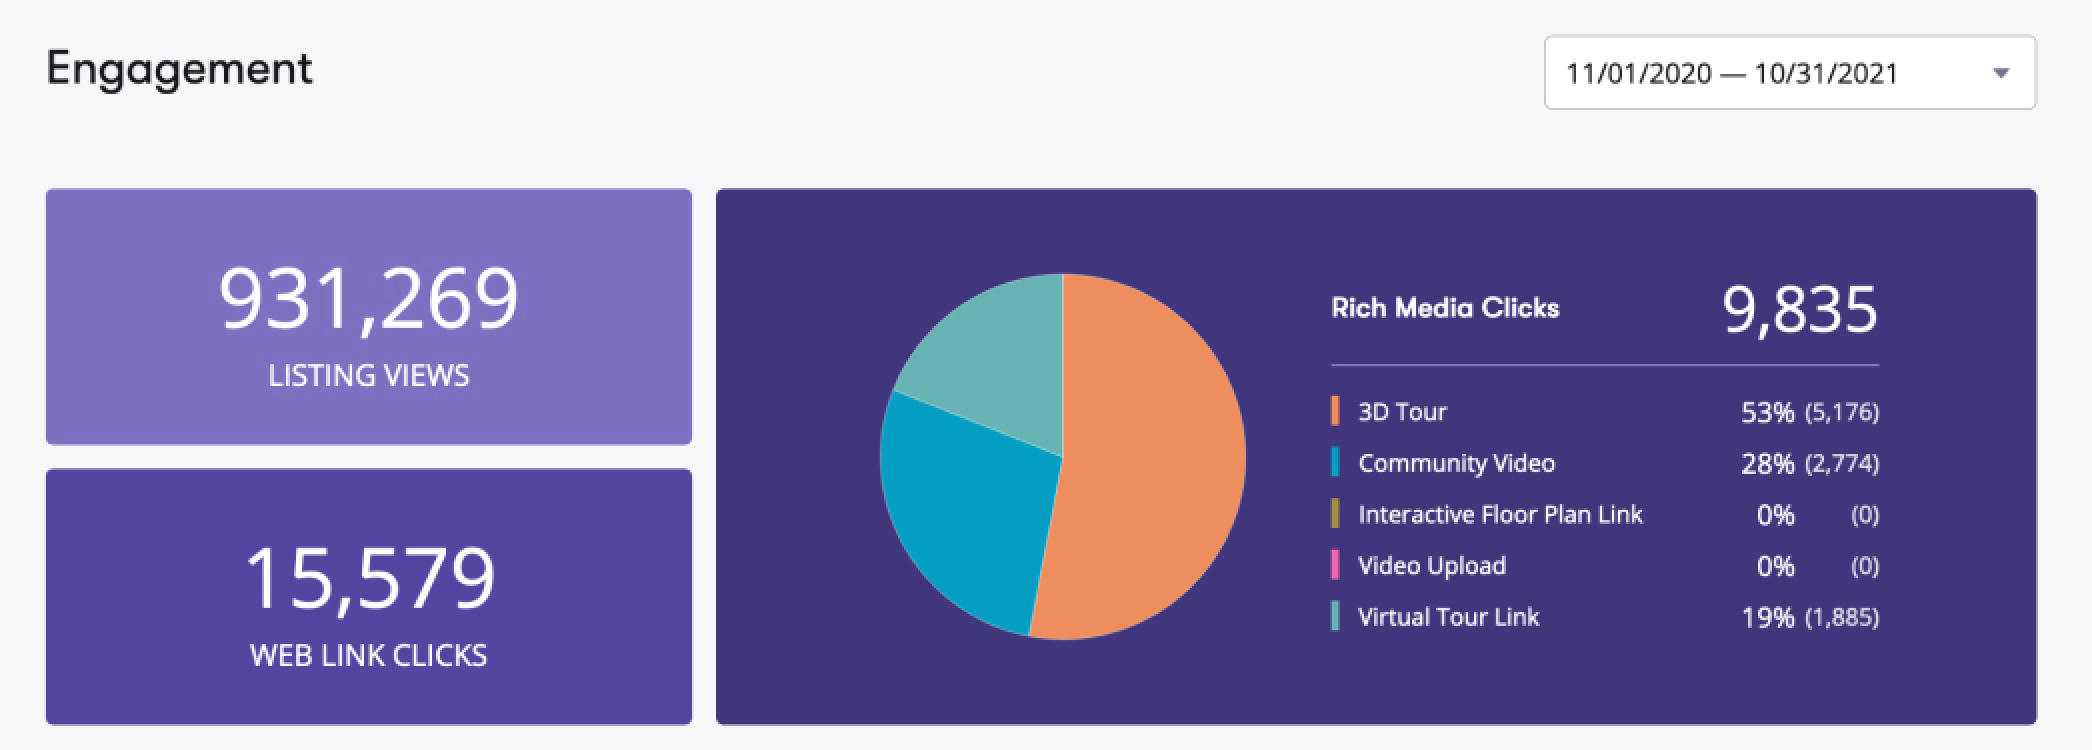
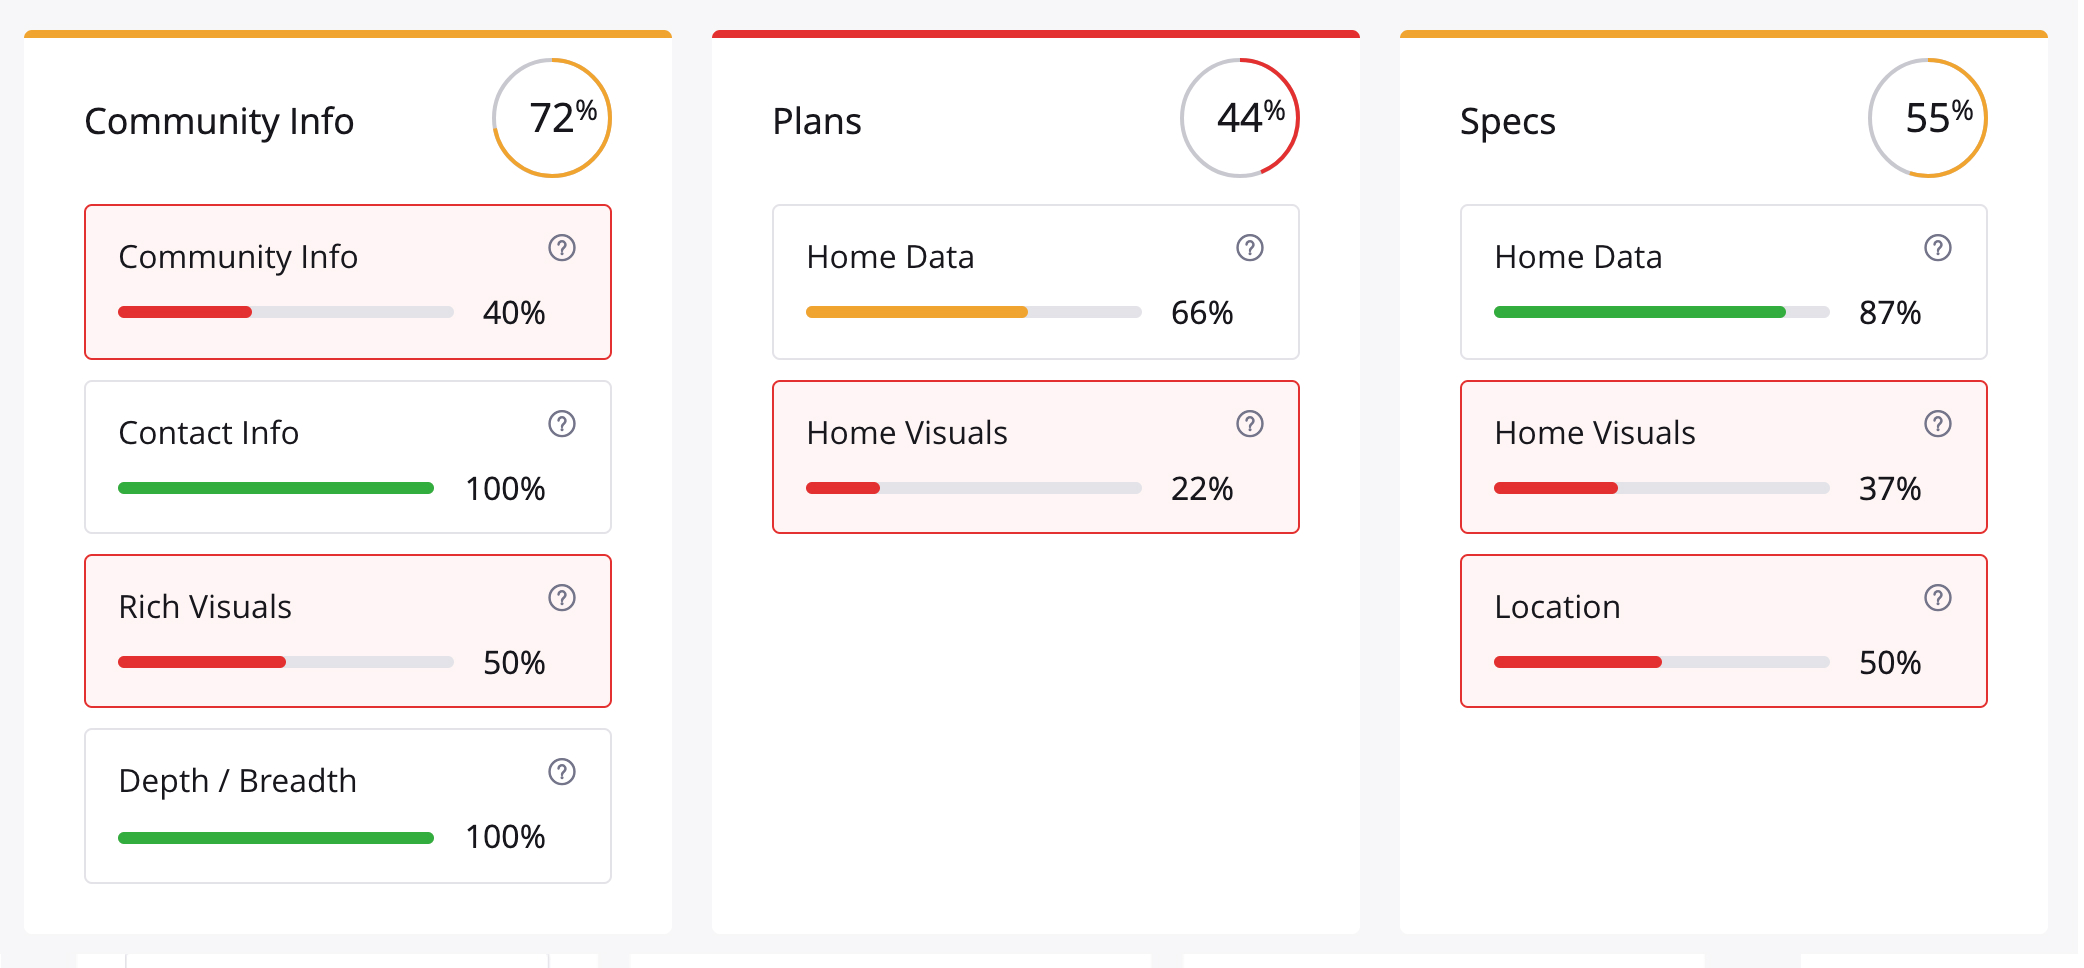
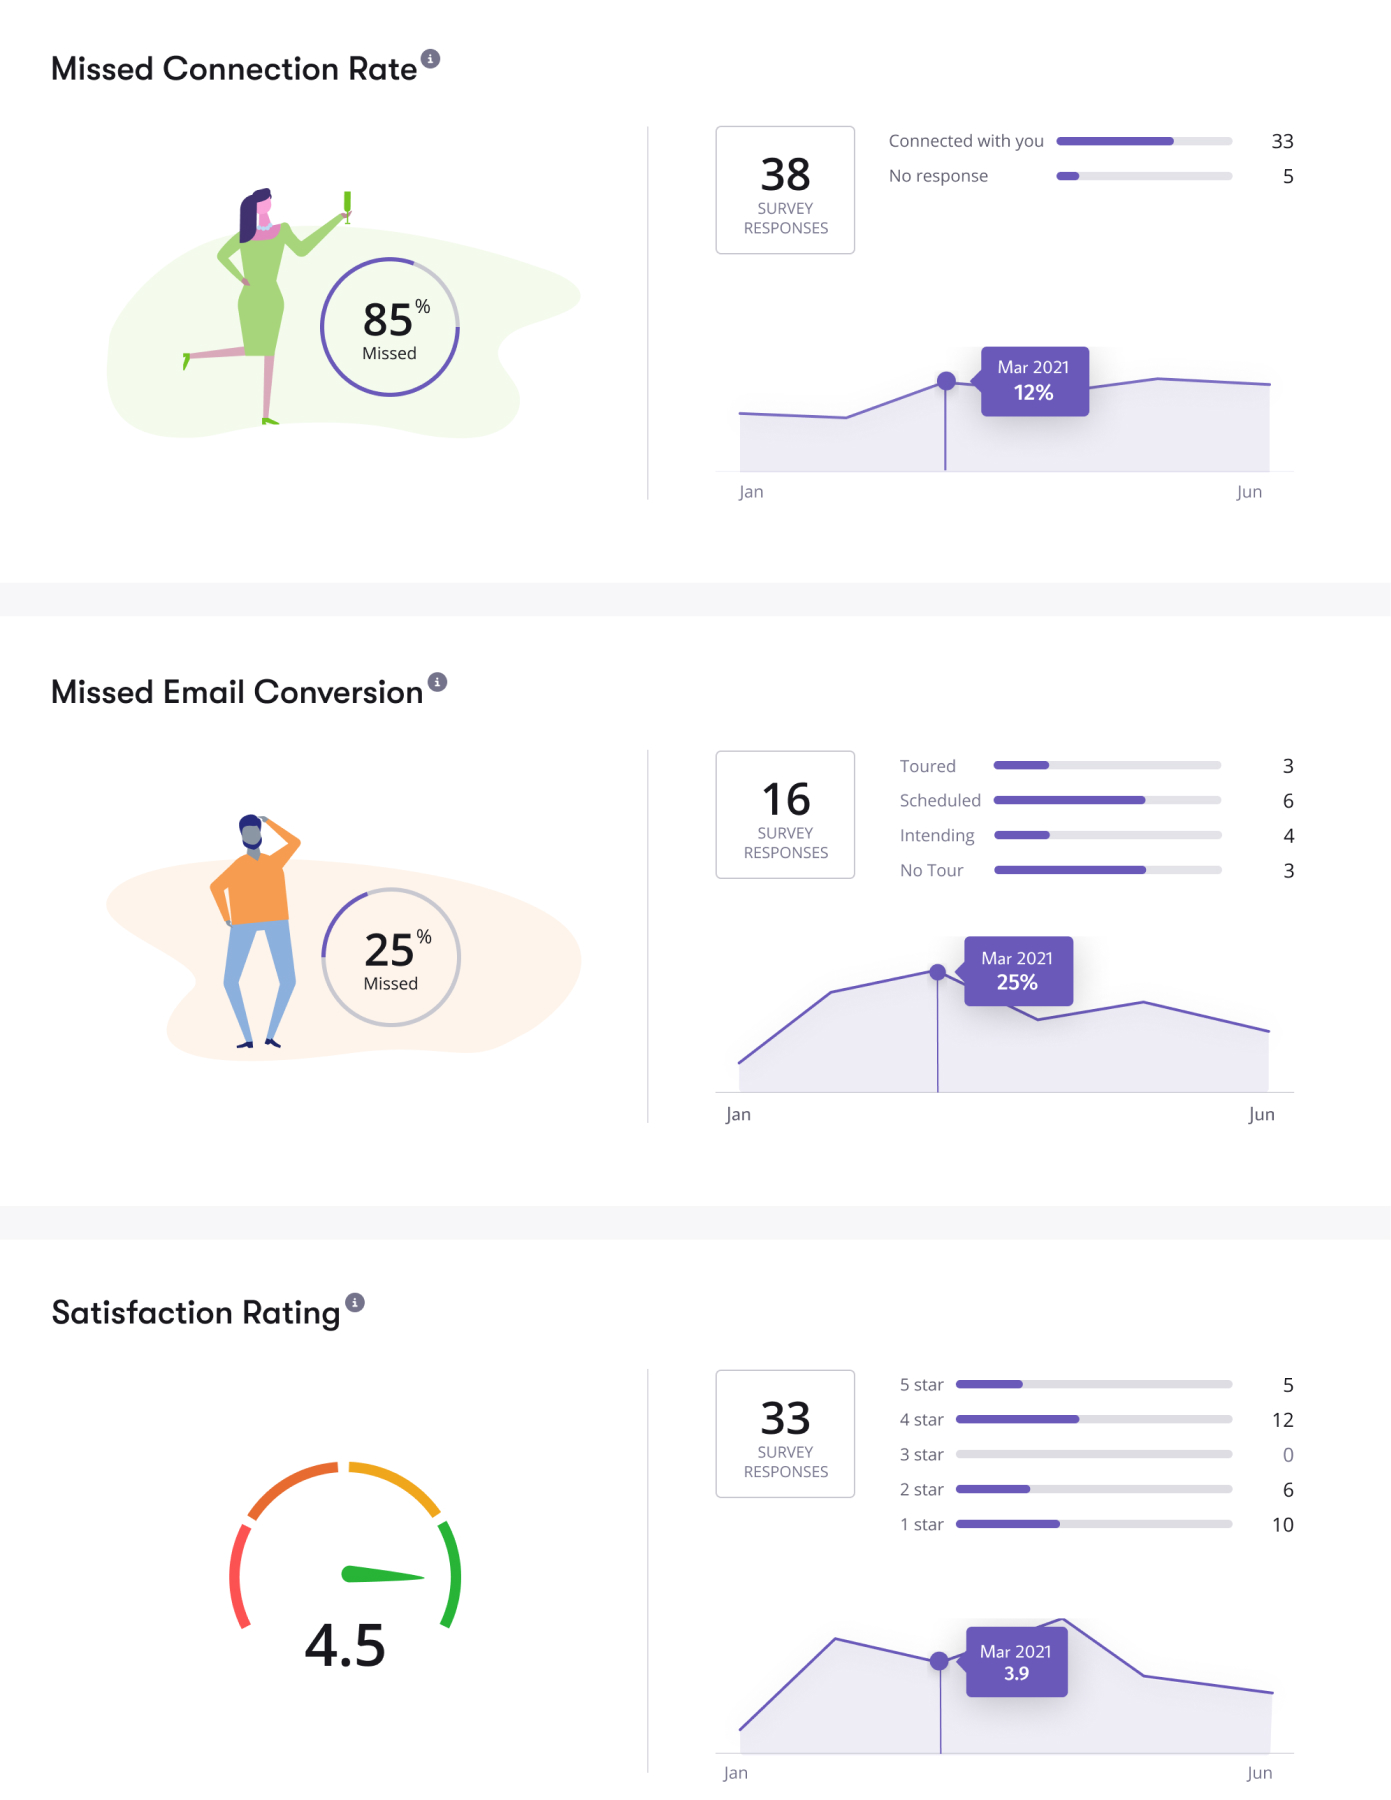
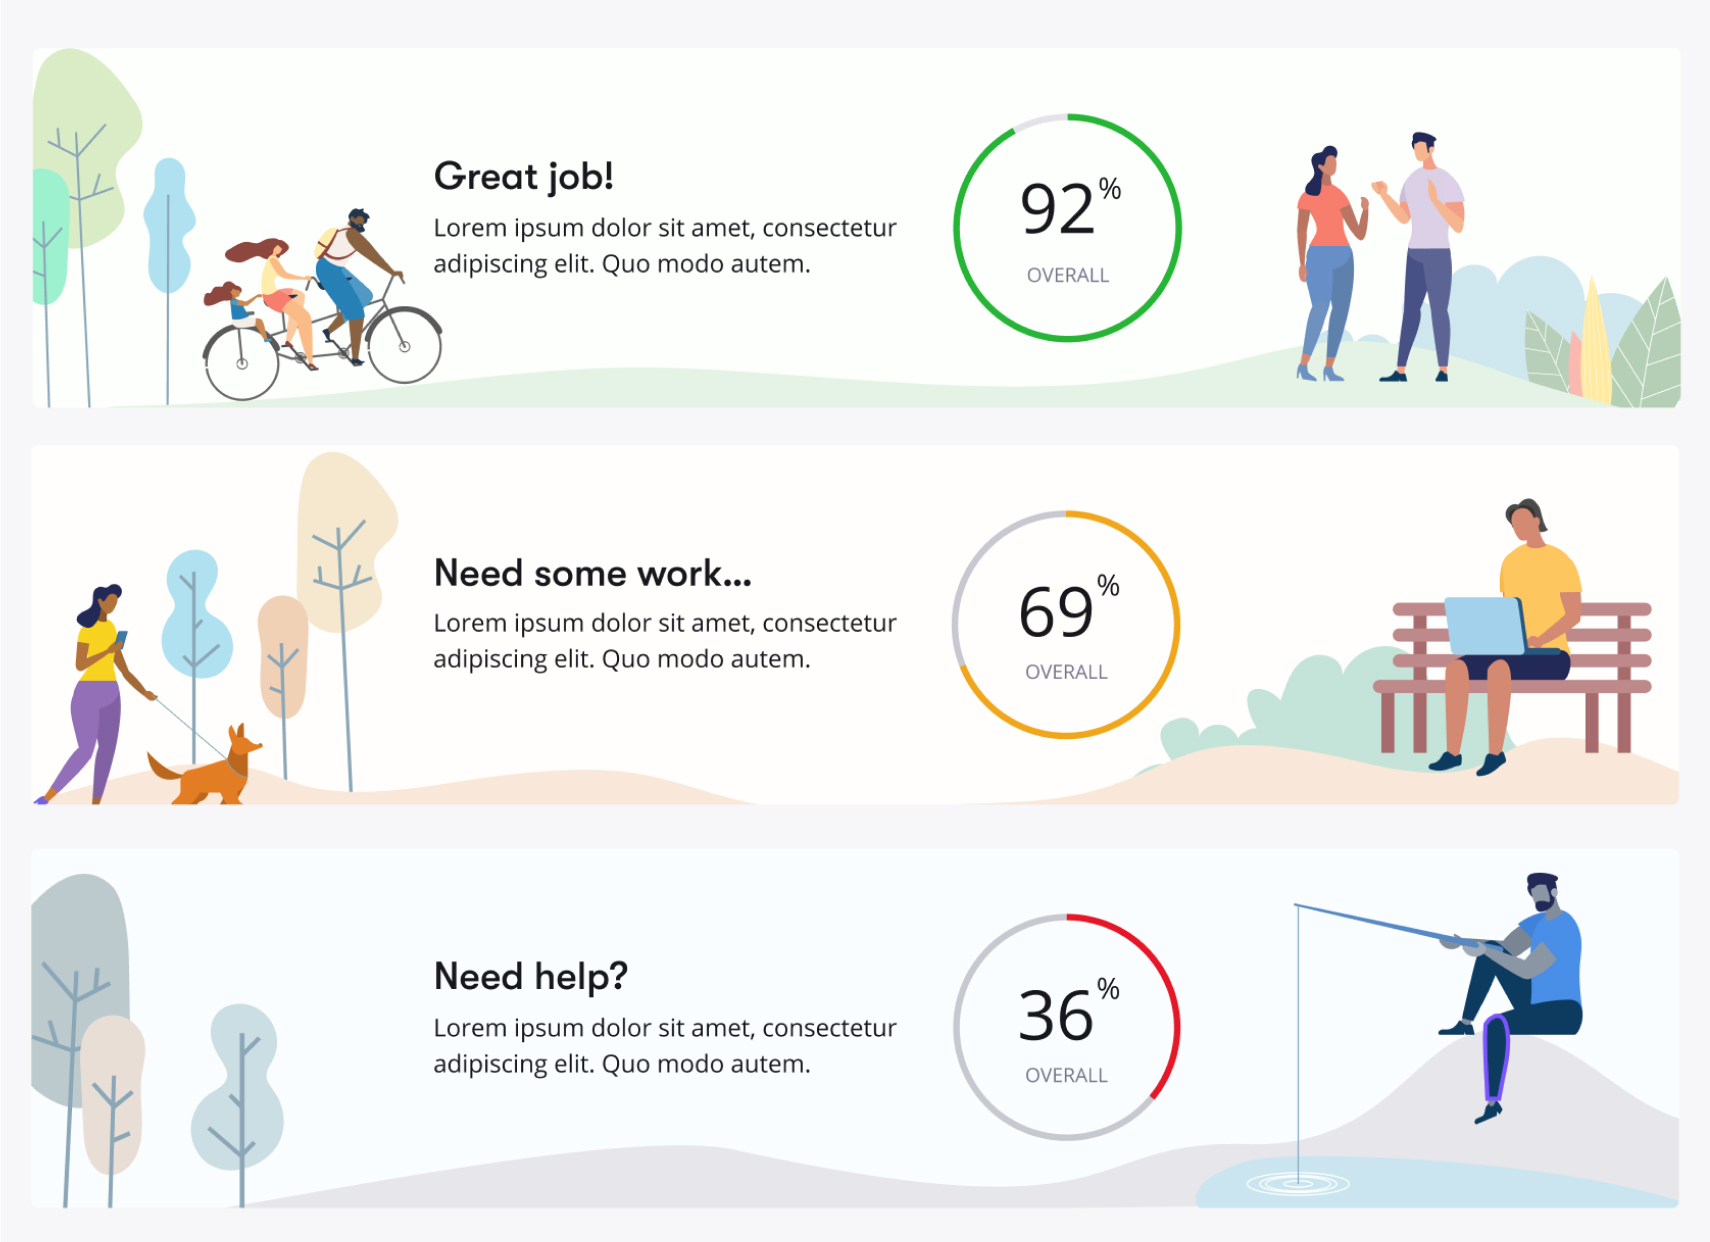
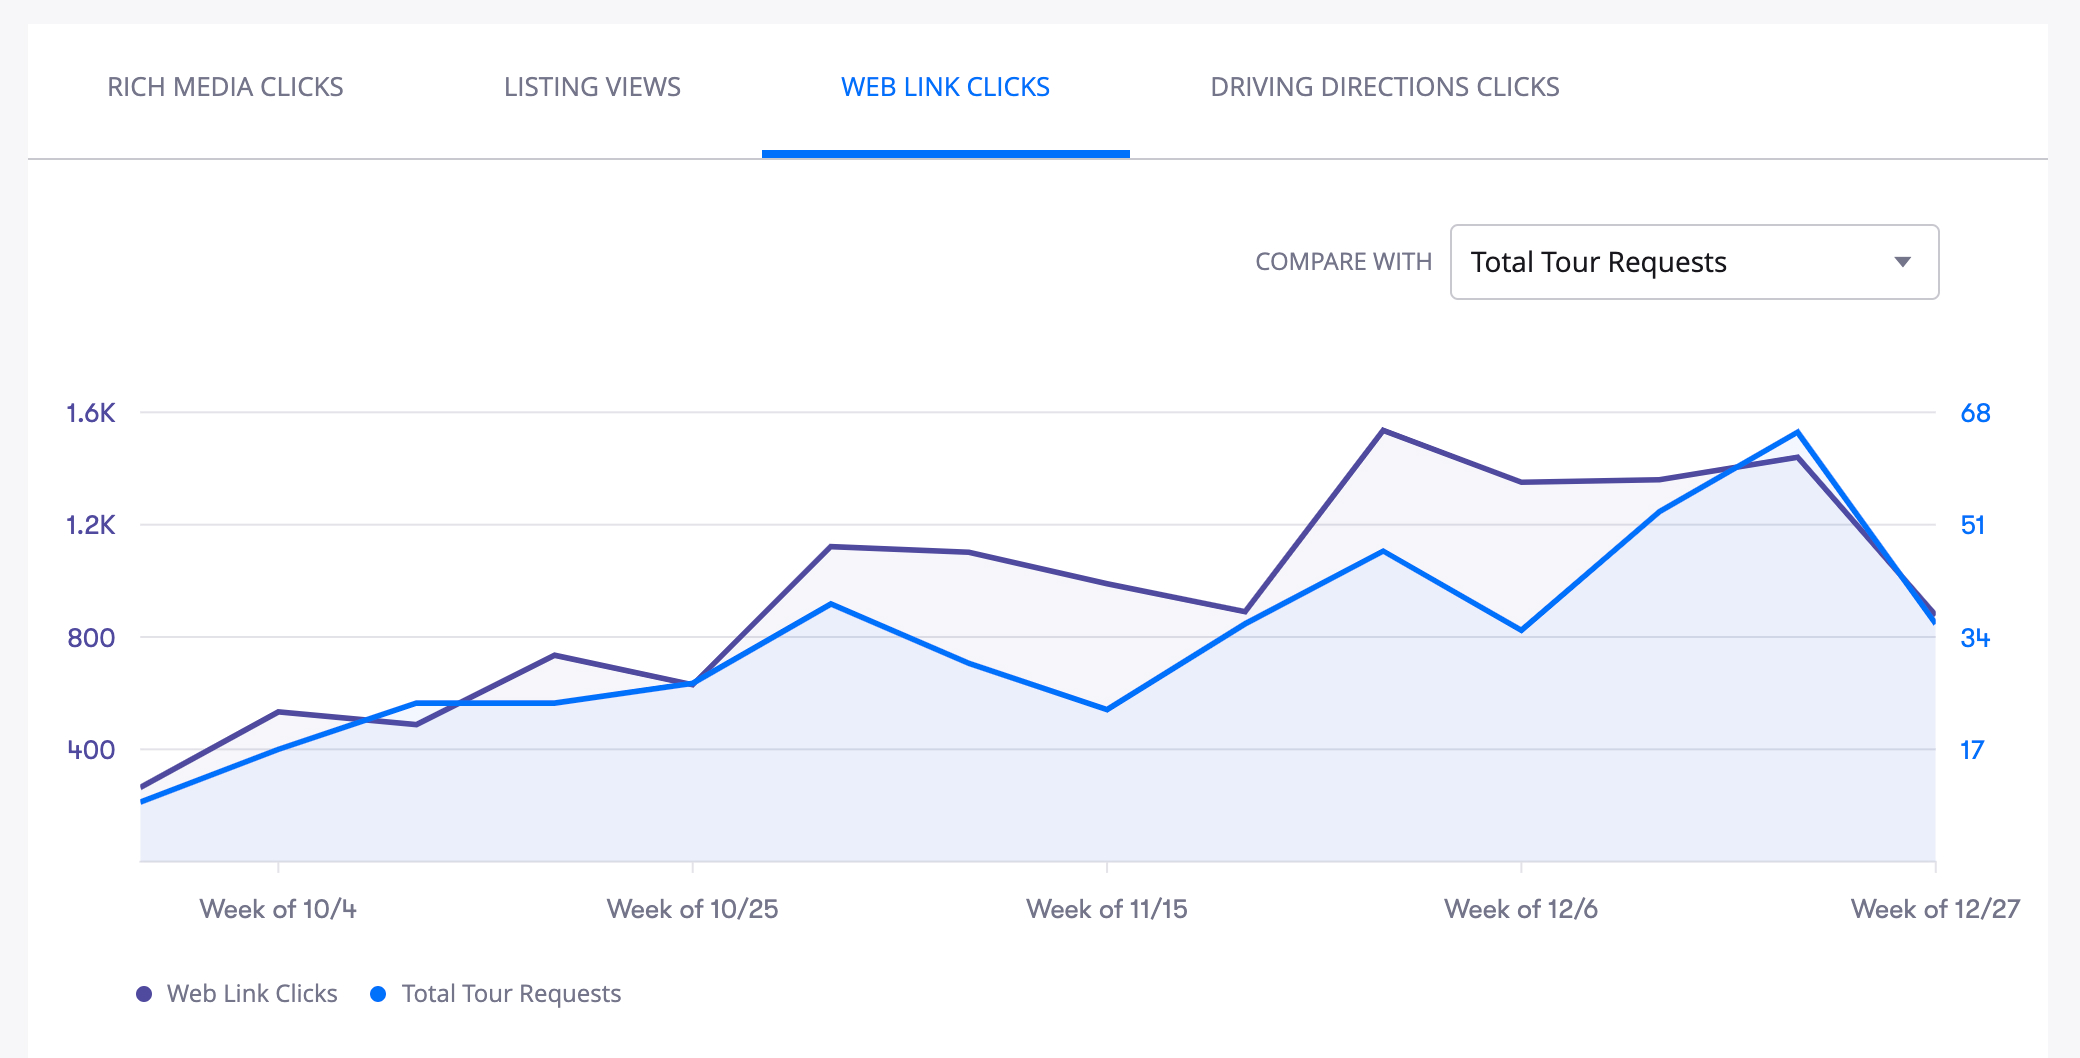
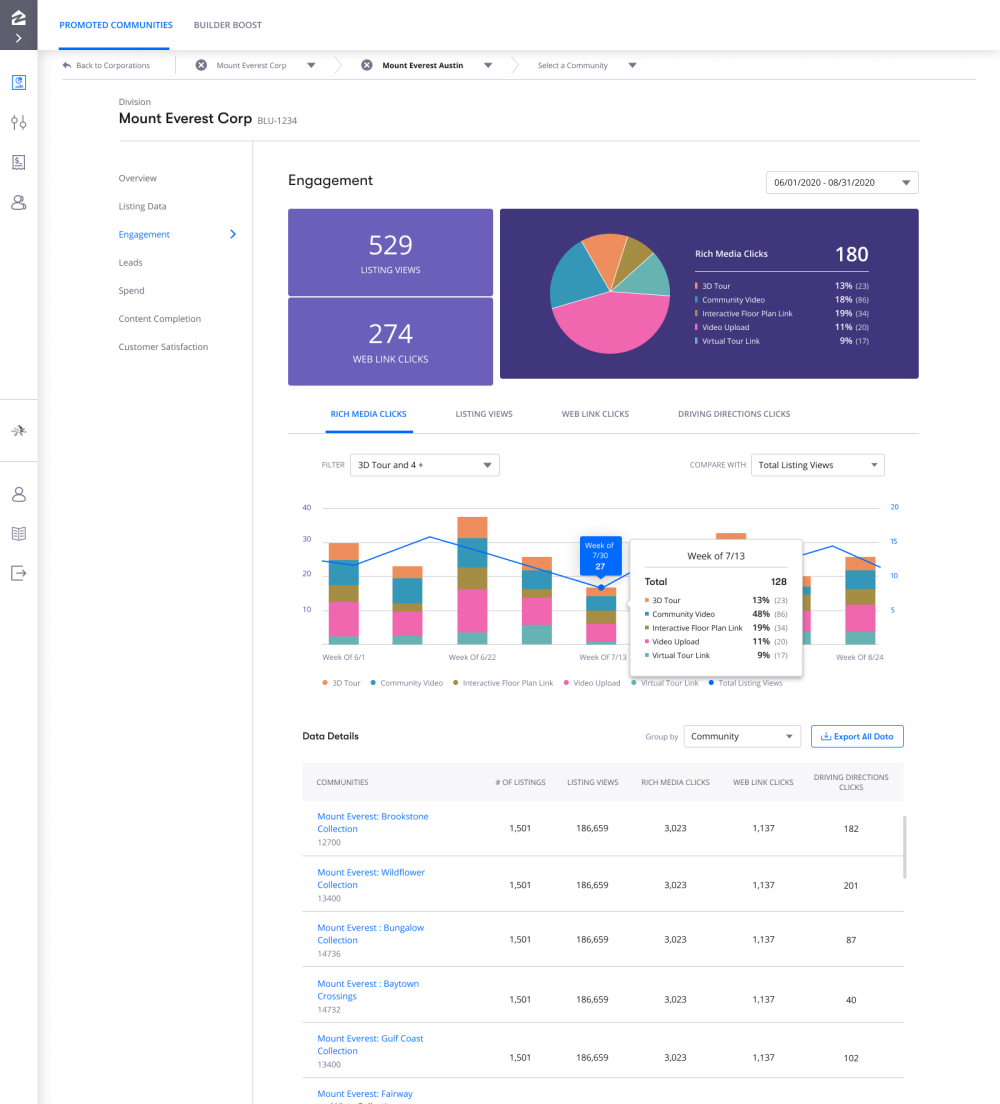
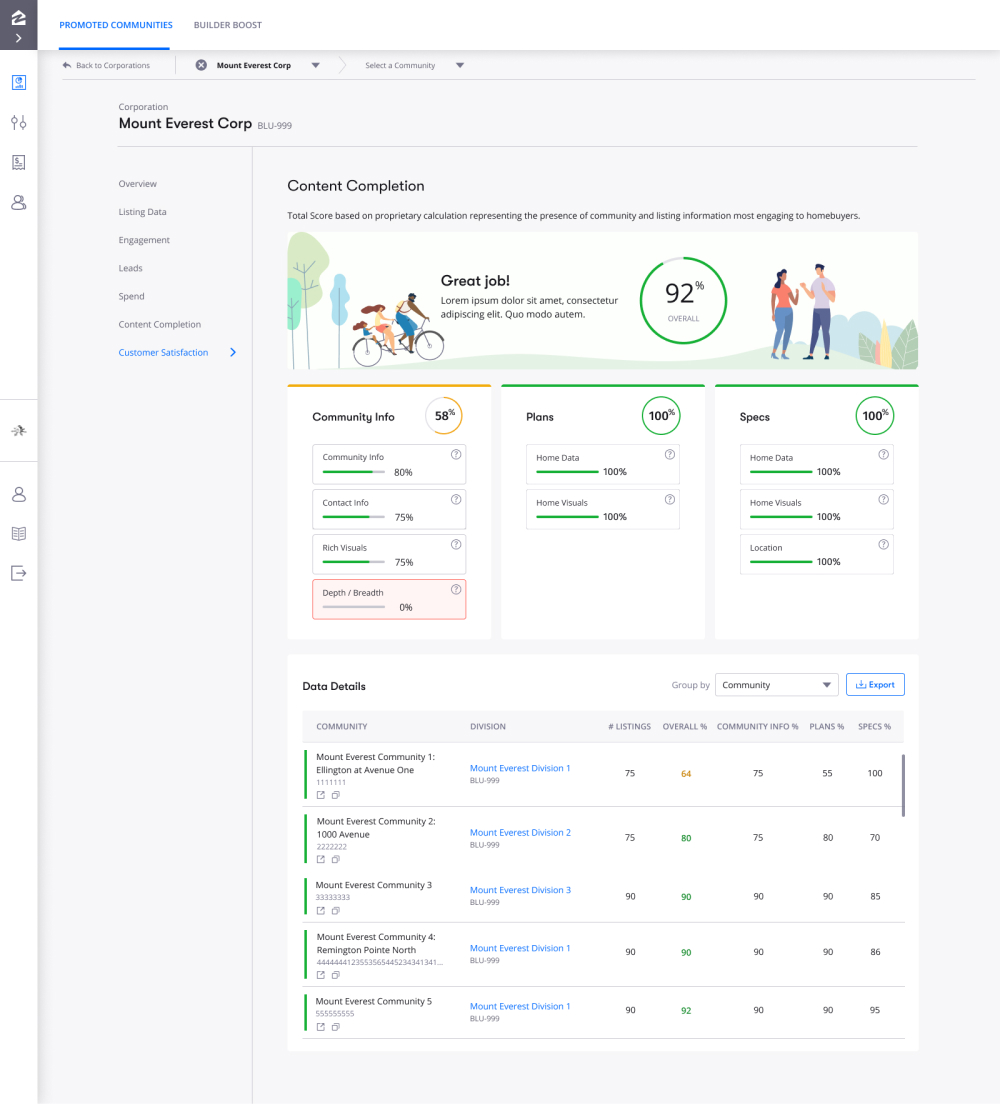
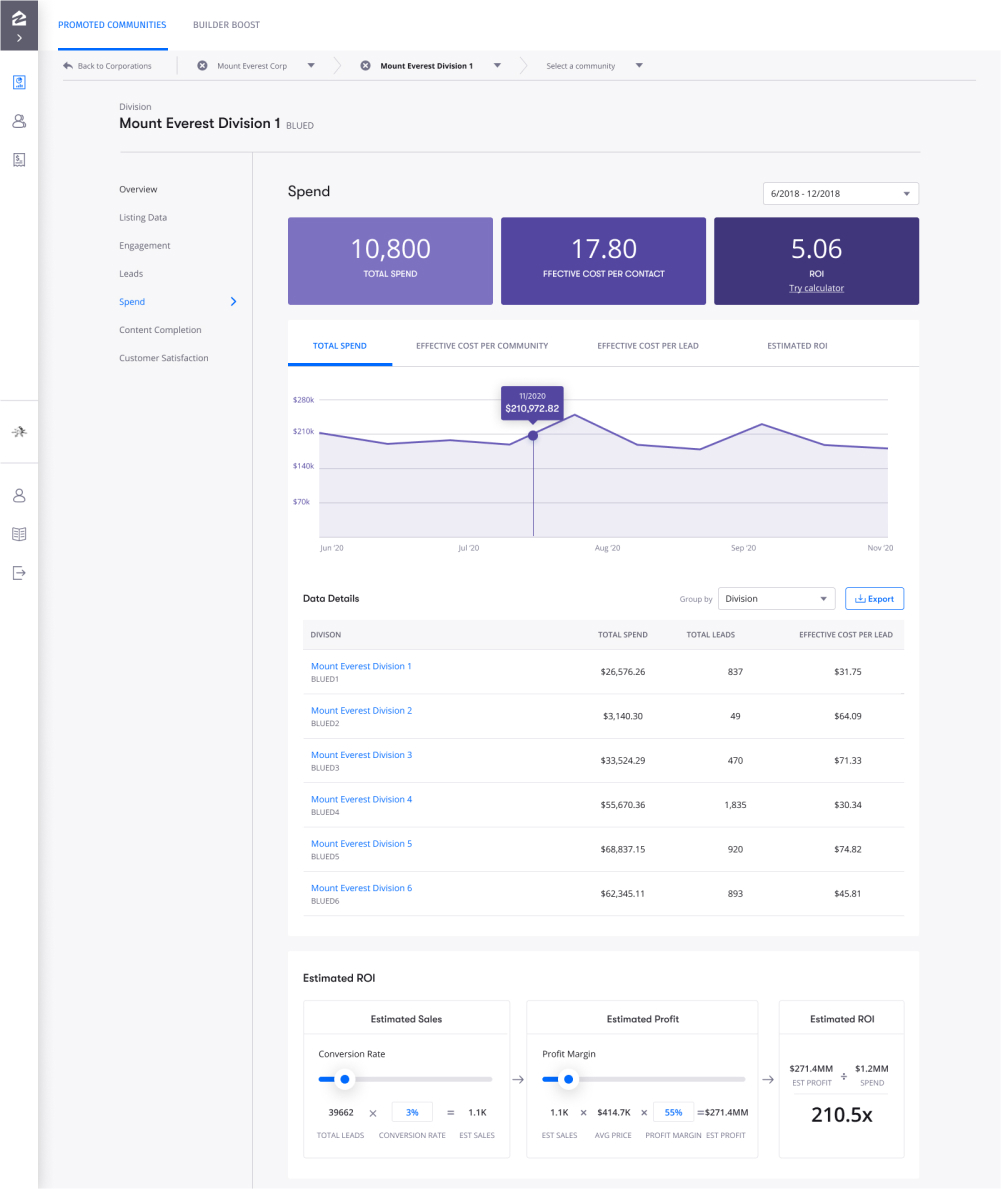
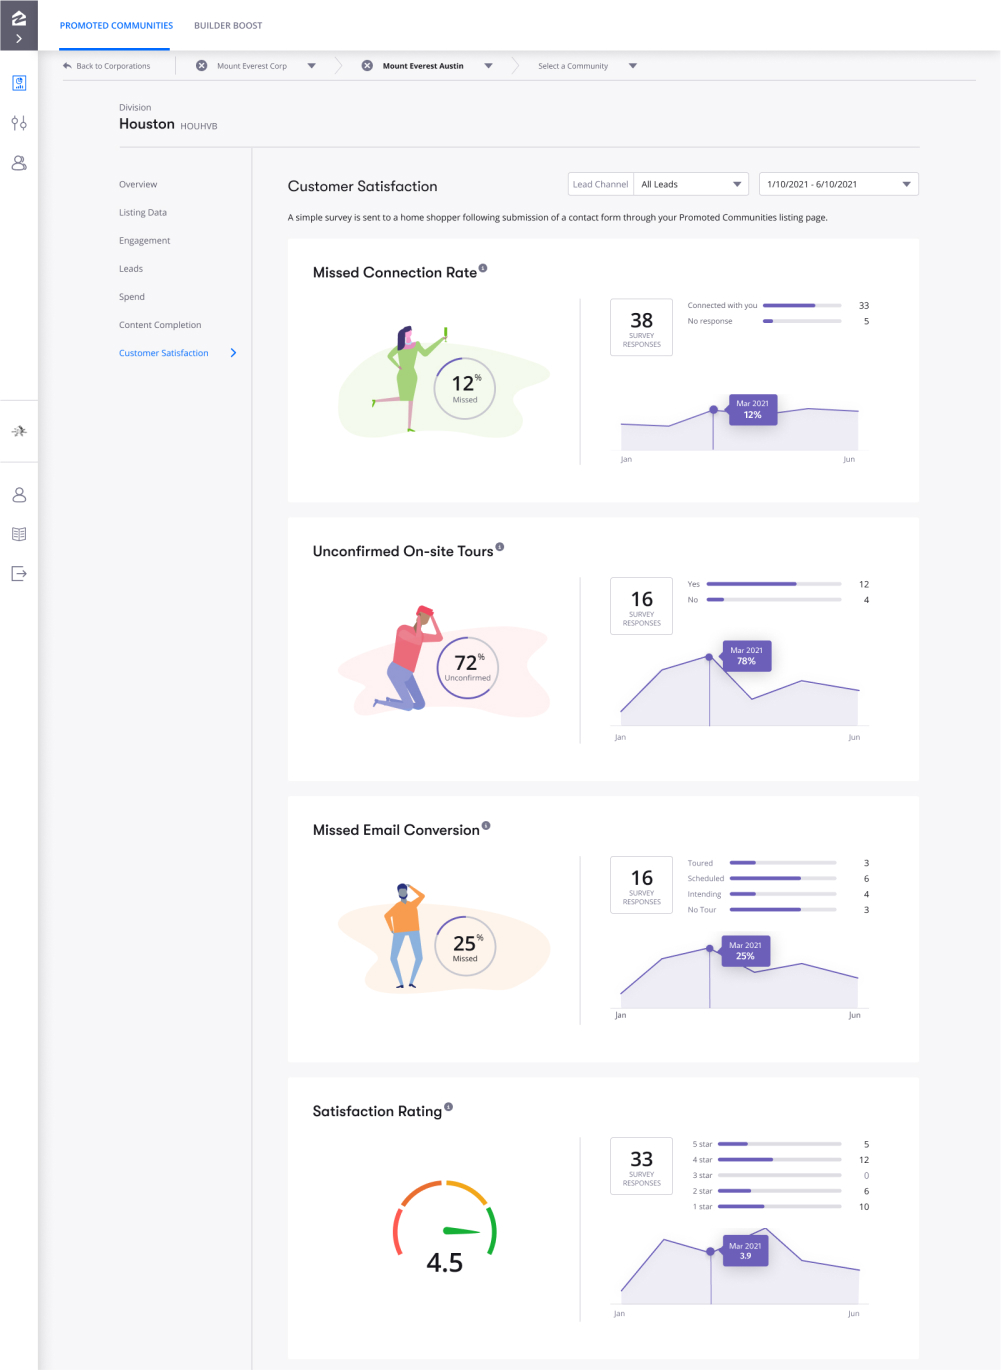
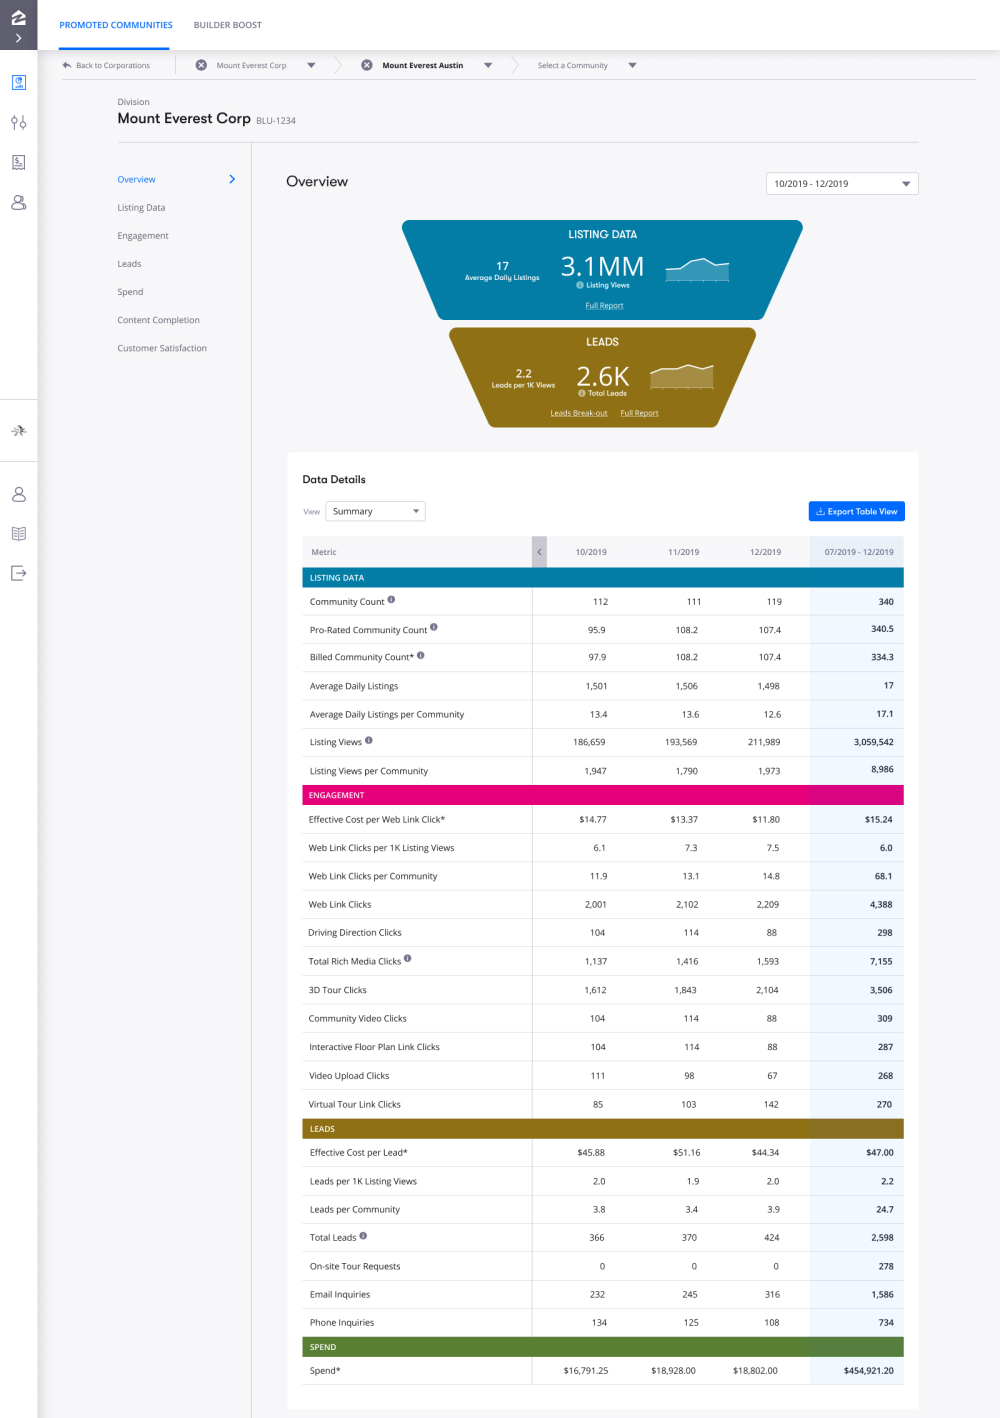
Various data visualizations for different types of data.
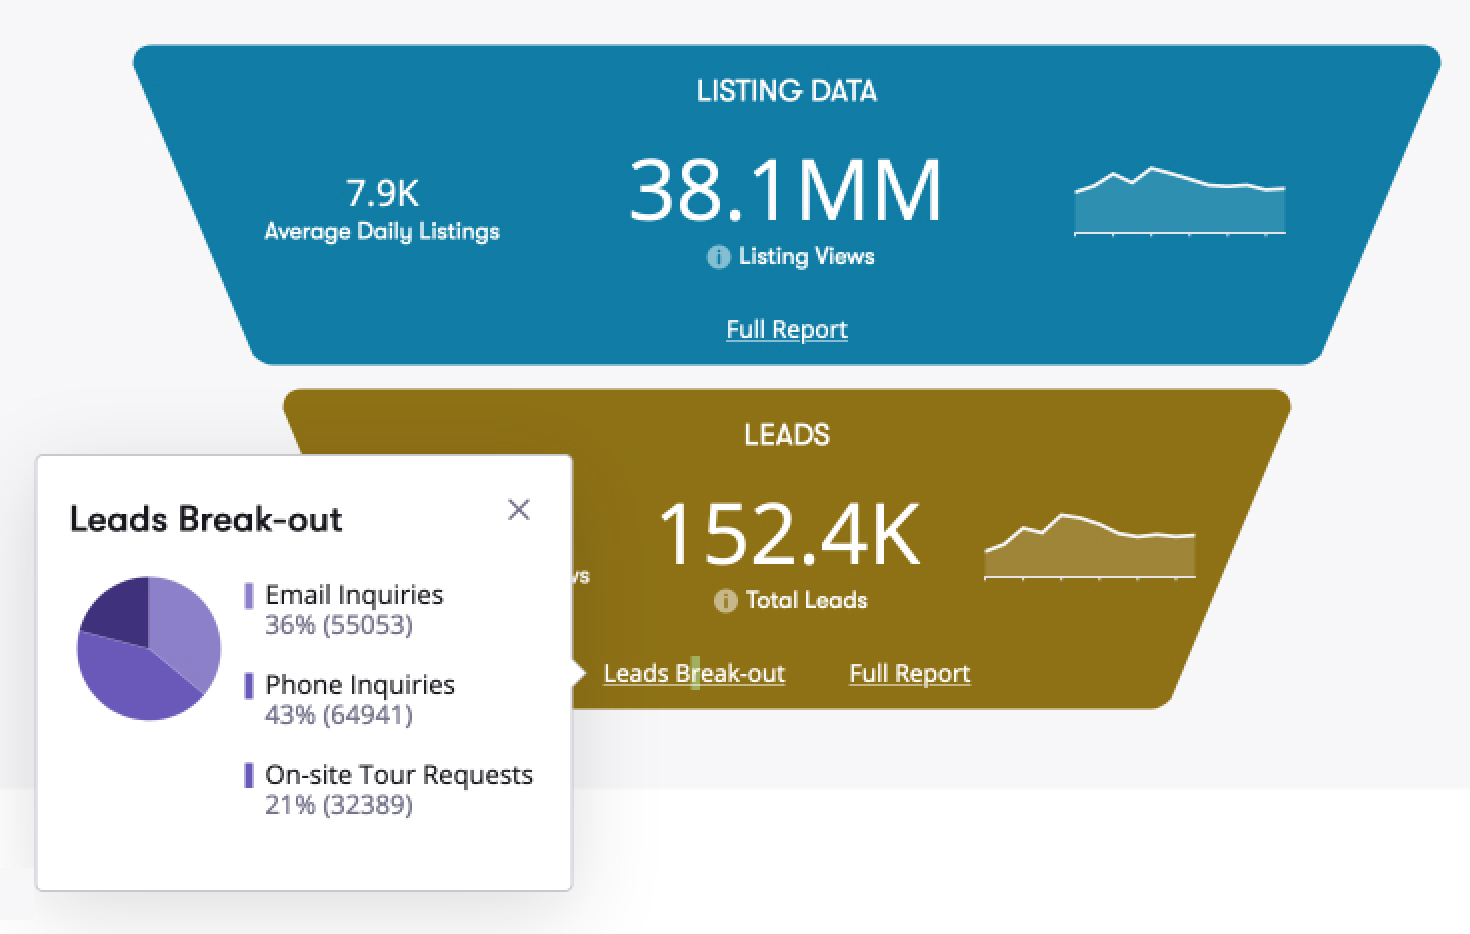
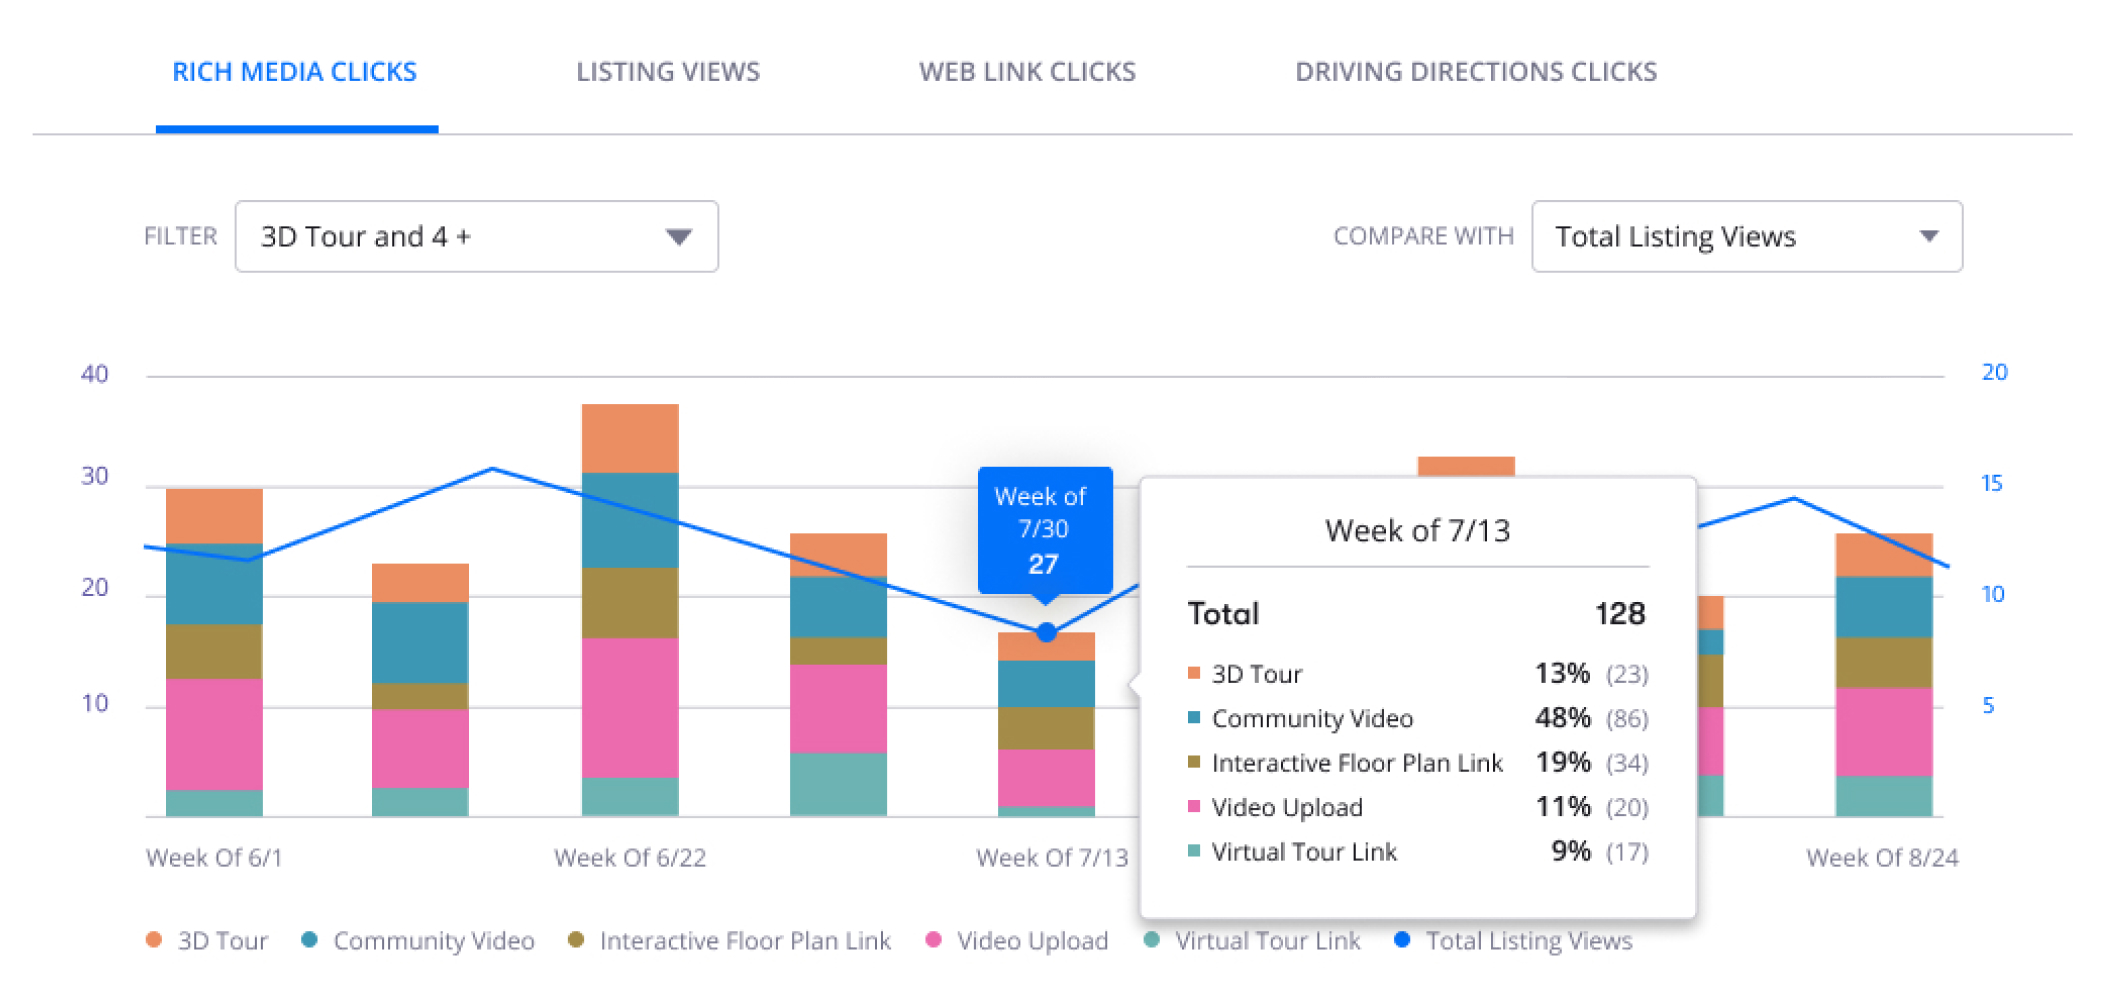
An easy way to compare metrics
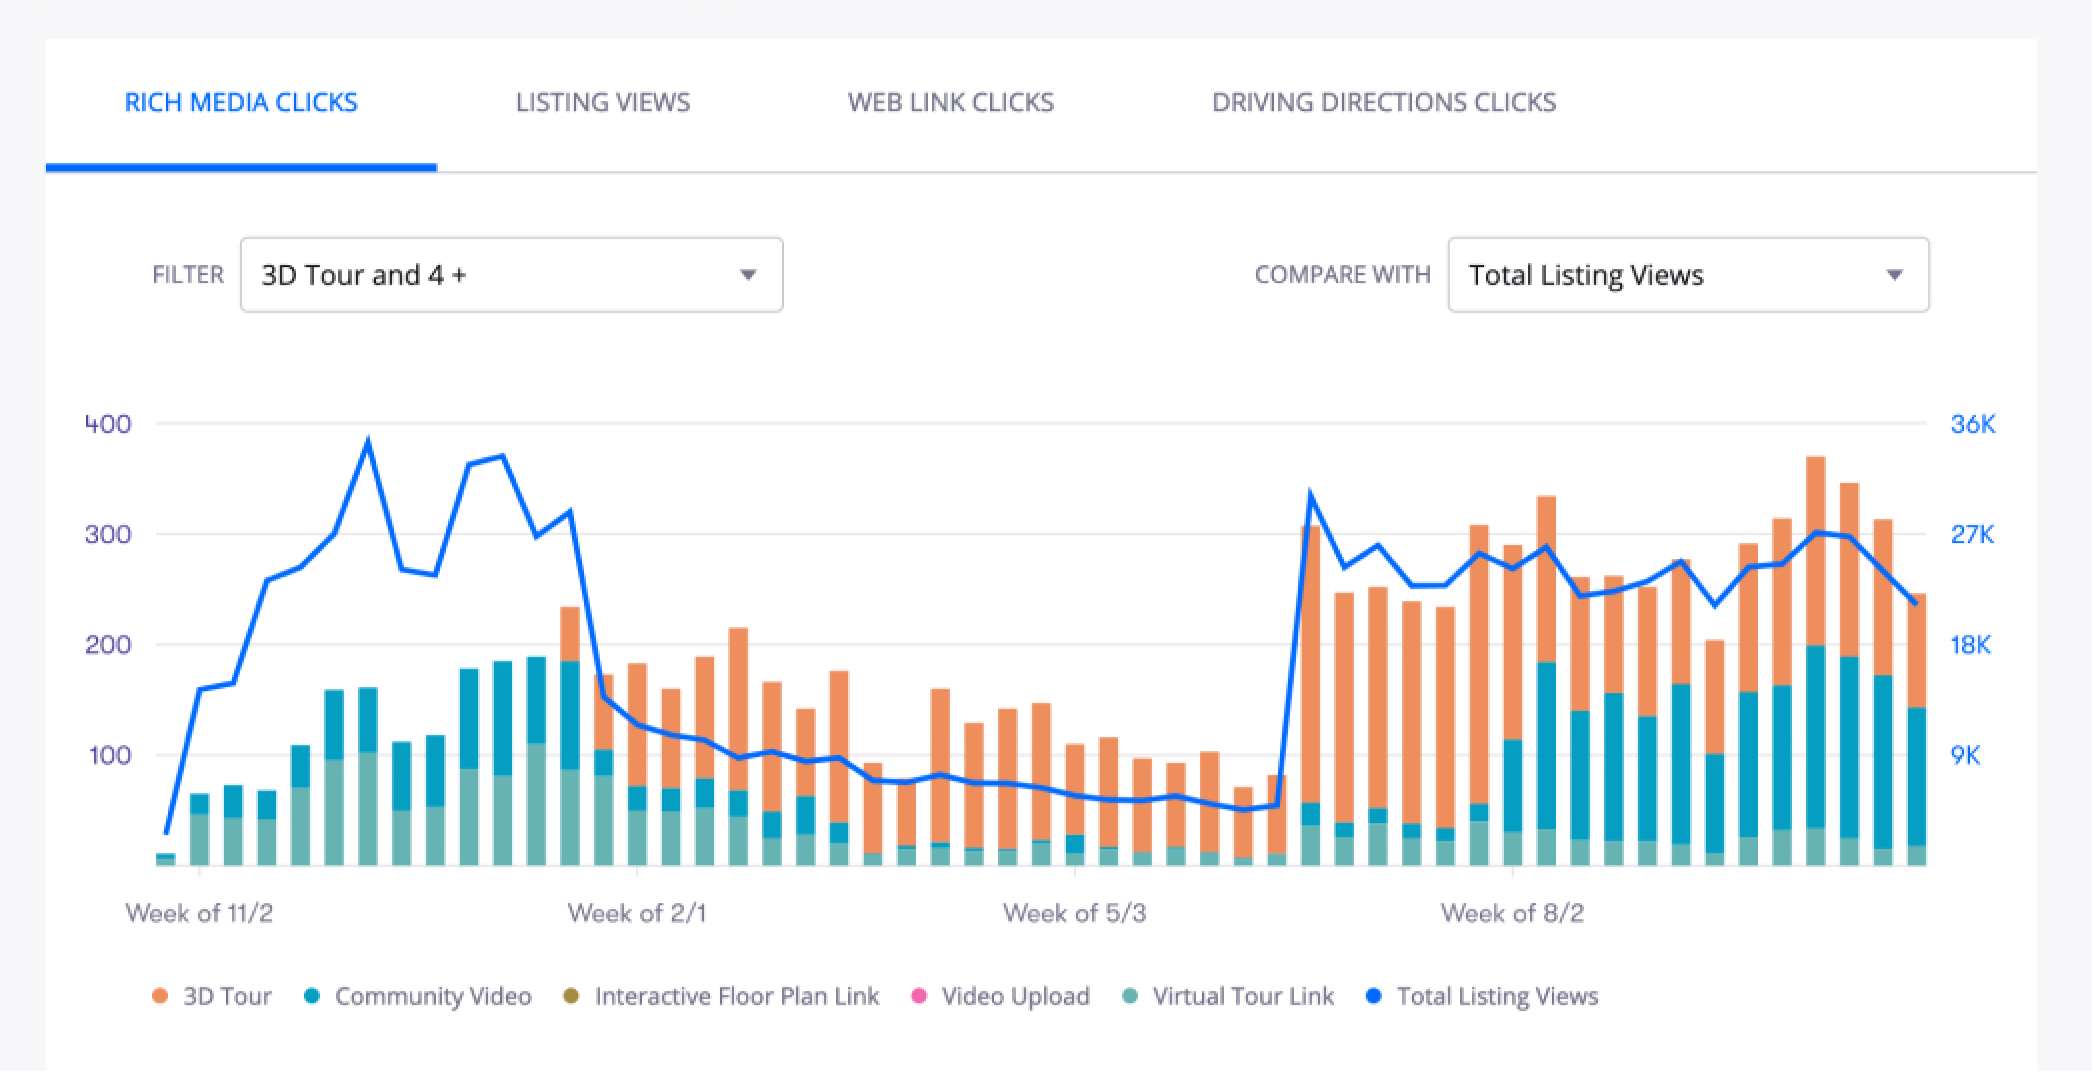
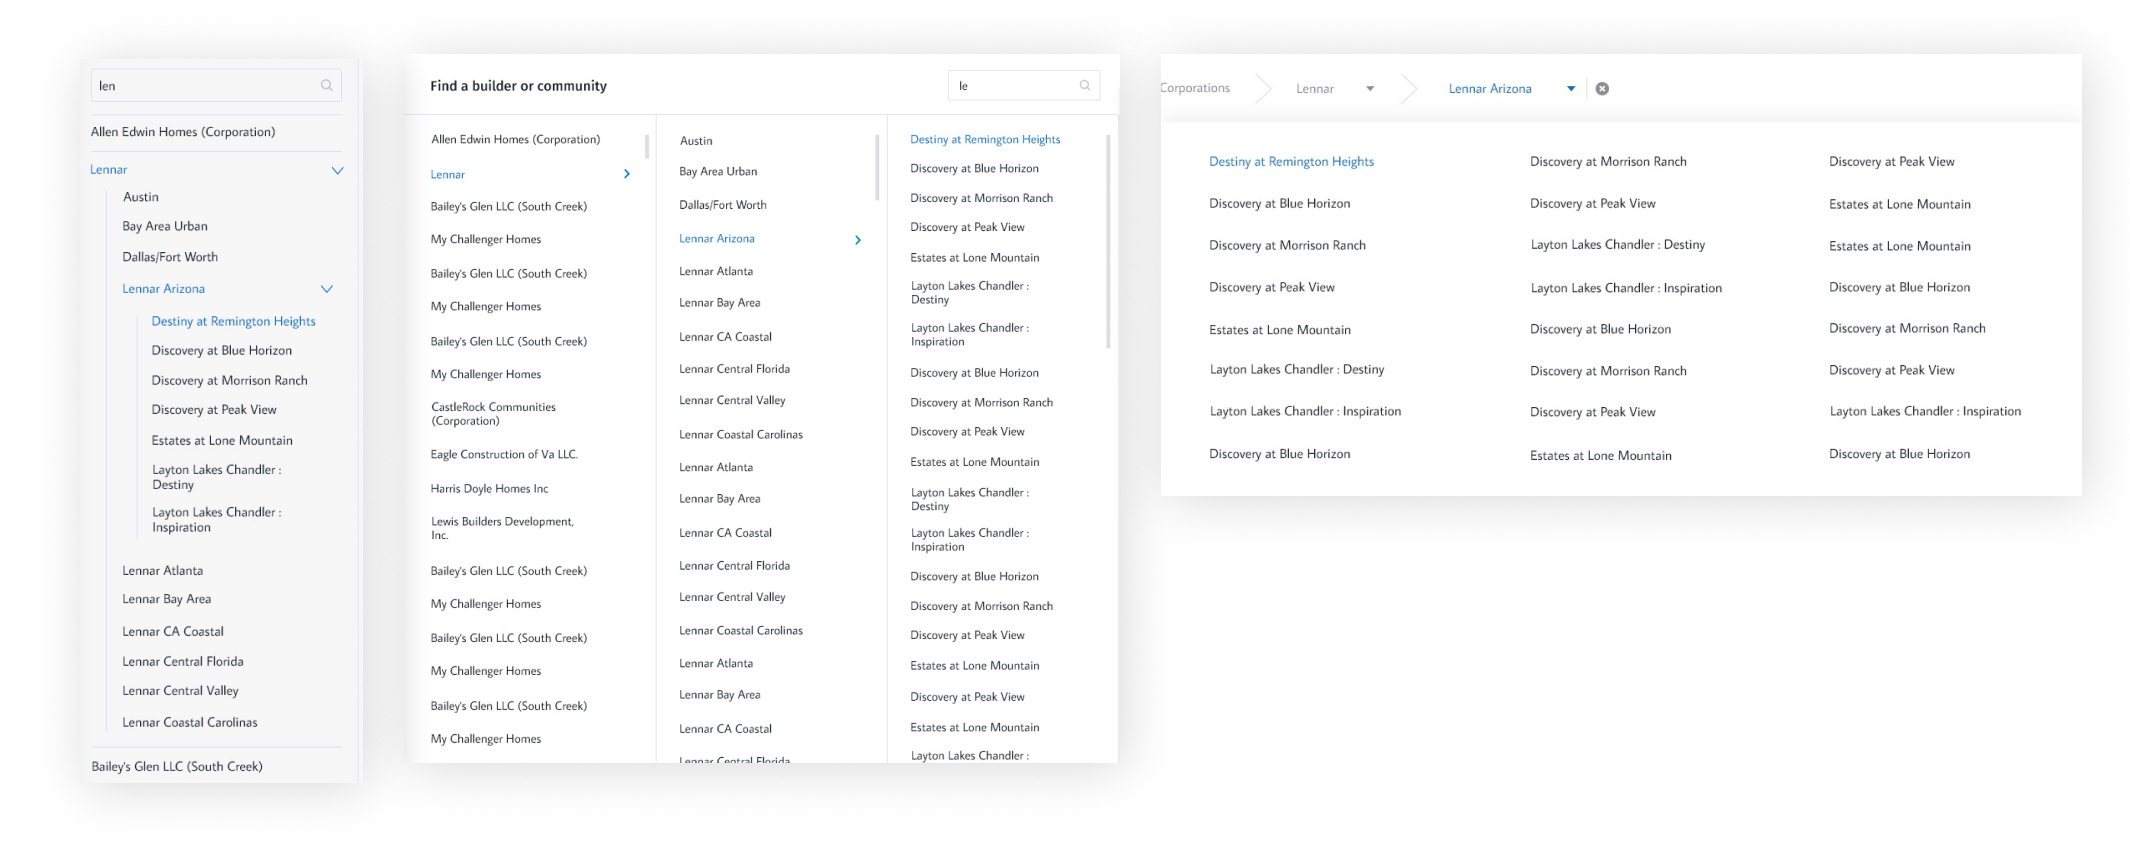
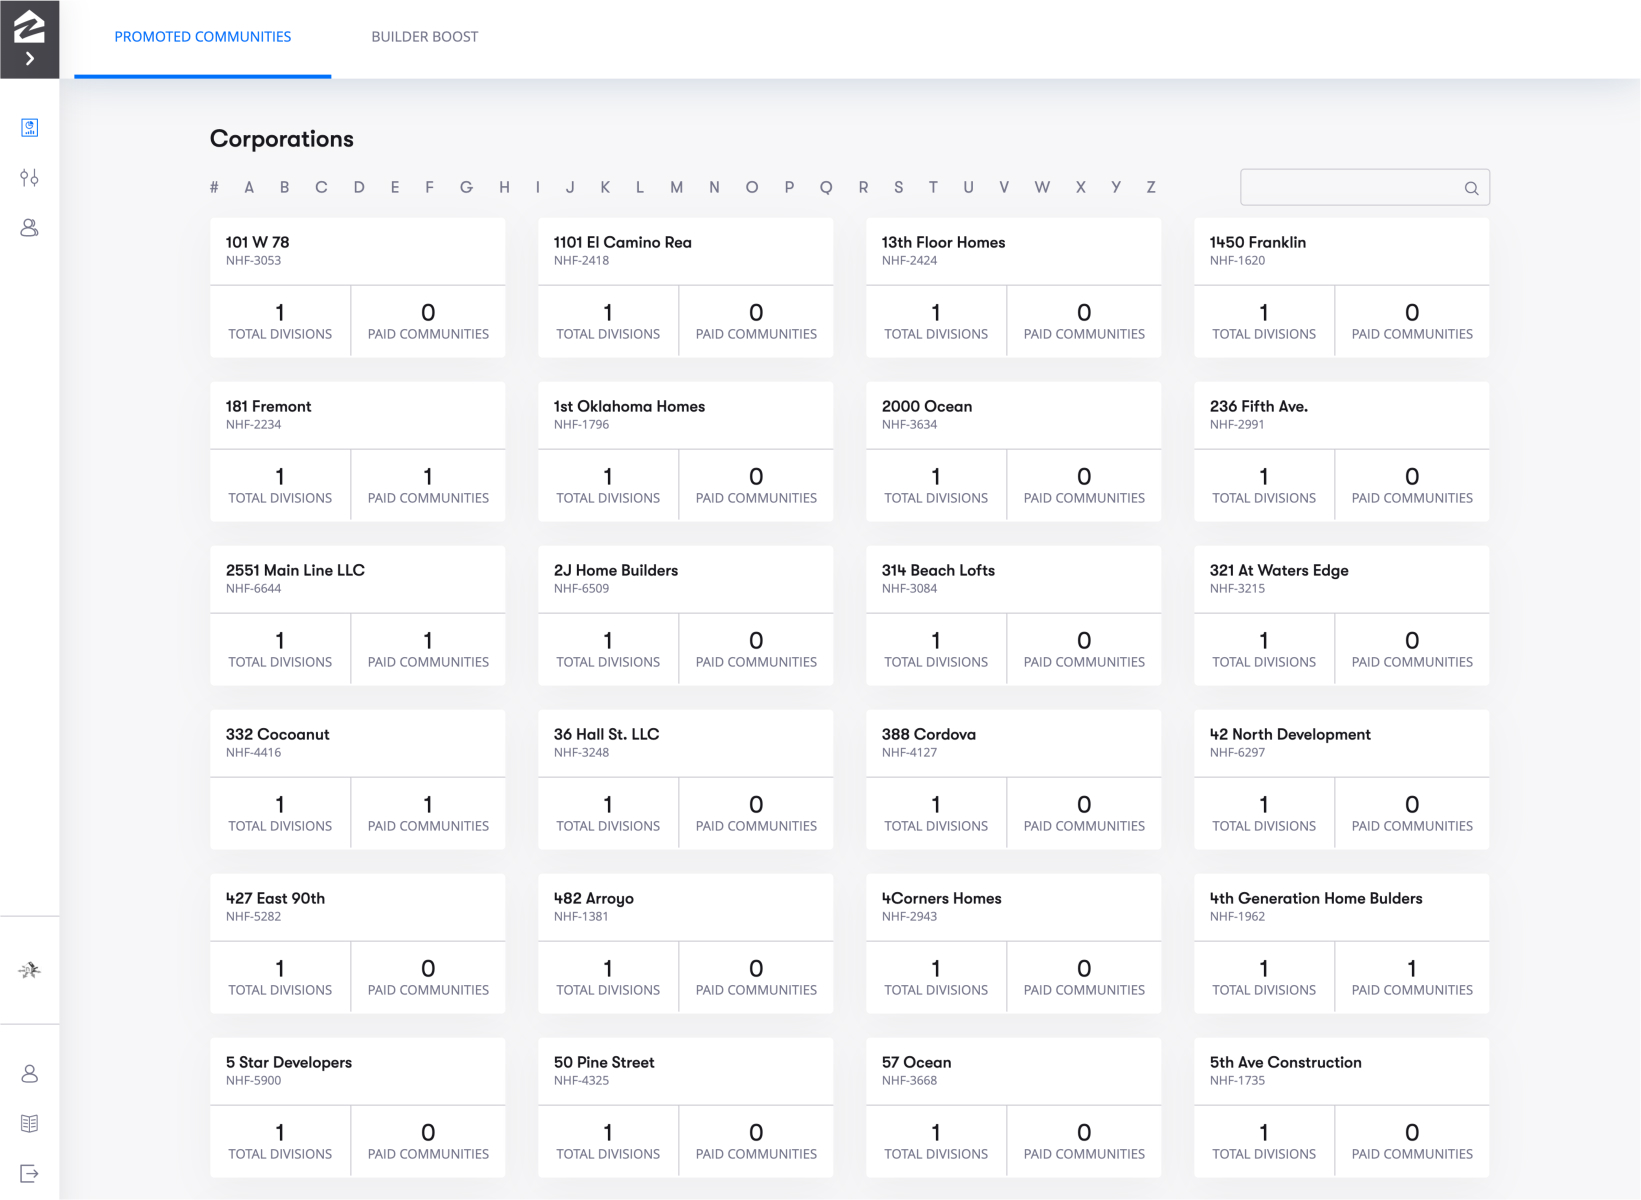
A filter lets users drill down from corporation to community following their org structure.
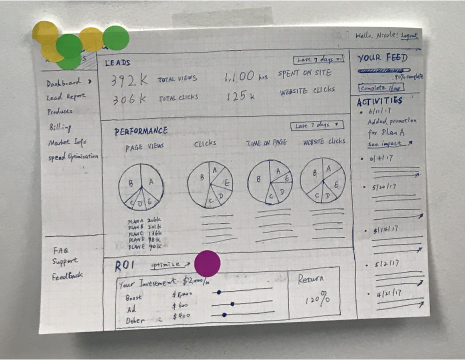
Design
Iteration